
Stellar (XLM) surged as much as 33% in just one hour as several technical indicators turned bullish, but quickly lost almost all of it as the day progressed. What’s next in the store for Stellar and should you consider buying XLM?
Fundamental analysis: fundamentals stay the same, technicals caused the pumpStellar is a Ripple Labs protocol-based cryptocurrency that allows money to be moved and stored. It was released in July 2014, with its main goal being boosting financial inclusion by reaching the unbanked people across the world. However, the focus soon shifted towards helping financial institutions and firms to connect with one another through blockchain technology. Stellar’s native cryptocurrency is called Lumen (XLM) and serves as a bridge between asset traders.
Stellar has been hovering around the crypto market top10, briefly entering and leaving its ranks. The cryptocurrency was in a descending triangle formation that it started forming since 7 Jan until a day ago, when its price spiked officially broke the formation.
Stellar’s overall outlook is very bullish, mostly due to its technicals rather than fundamentals. XLM managed to score week-over-week gains of 7.80%. When compared to other cryptocurrencies, it fell short to Bitcoin’s (BTC) and Ethereum’s (ETH) gains of 10.91% and 10.92%, respectively.
At the time of writing, XLM is trading at $0.30, representing a month-over-month price increase of only 0.75%. Stellar is currently the 11th largest cryptocurrency by market cap, boasting a value of $6.7 billion.
XLM/USD technical analysis: price spikes as indicators turn bullishStellar broke out of its descending triangle that started forming on 7 Jan. The cryptocurrency was making a series of lower highs within the triangle, but kept its price above the $0.23 each time the price descended. A recent spike in buying pressure caused XLM to push its price and break the formation. On top of that, several technical indicators, including the Parabolic SAR, Supertrend, and MACD indicator, pointed towards the buy-side. .While its price did end up in a slight net-gain, XLM’s future price direction is at question.
XLM is currently trading between the 38.2% and 50% Fib retracement levels. Even though the 38.2% level is a very strong resistance level, XLM’s downside is well-guarded by the $0.284 level as well as the 21-day EMA. With all this taken into account, the cryptocurrency will most likely trade within this range in the short-term.
However, if its Supertrend or Parabolic SAR technical indicators turn bearish, XLM might push towards the $0.23, or even the $0.123 support level.
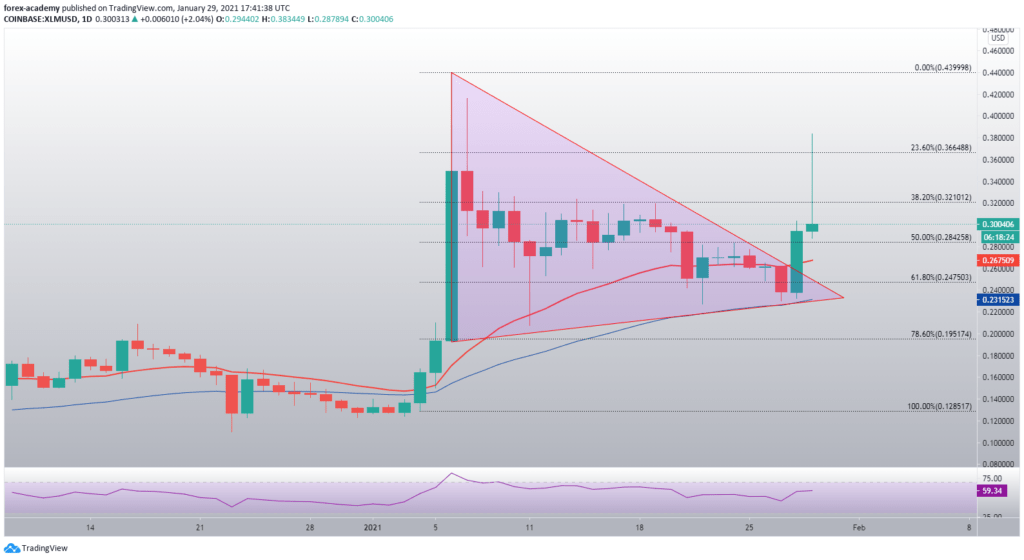 XLM/USD daily chart
 XLM’s daily time-frame RSI is hovering under the overbought territory, but is still remaining in the optimal value range. Its value is currently sitting at 59.34.
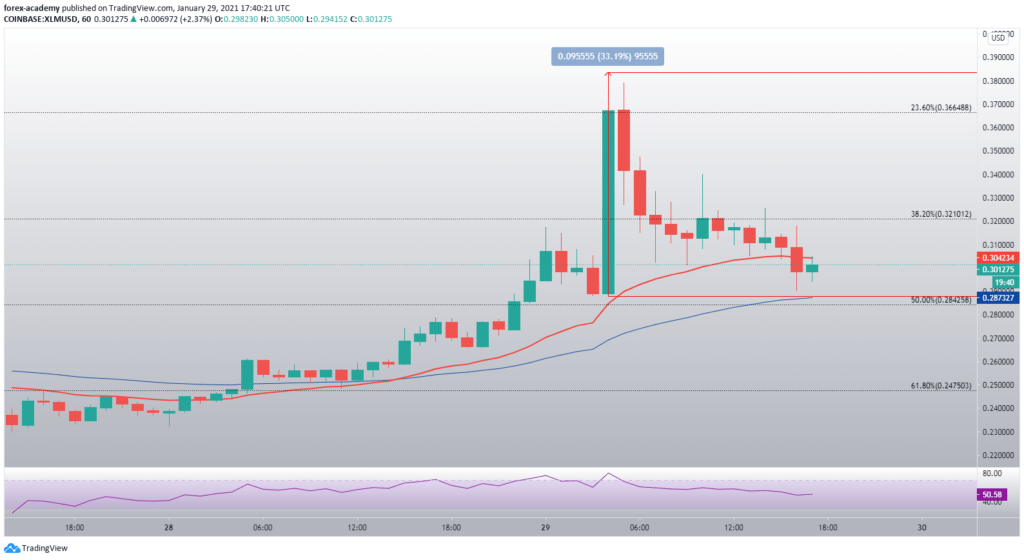 XLM/USD 1-hour chart
 XLM’s hourly time-frame shows us clearly how the cryptocurrency surged as much as 33% in just one hour, and then lost it all. While almost every single technical indicator pointed towards the buy-side, XLM bulls didn’t have enough strength to maintain the gains, thus causing a sharp retracement. Over the course of the day, the cryptocurrency lost almost all of the gains gained during the aforementioned 1-hour pump.
XLM is currently fighting for the $0.3 level, and is seemingly stopped in its tracks by the 21-hour EMA.
The post XLM pumps and dumps: What’s next for Stellar? appeared first on Invezz.
