
Hardware products and merchandising solutions provider Hillman (NASDAQ: HLMN) missed Wall Street’s revenue expectations in Q4 CY2025 as sales rose 4.5% year on year to $365.1 million. The company’s full-year revenue guidance of $1.65 billion at the midpoint came in 1.9% below analysts’ estimates. Its non-GAAP profit of $0.10 per share was in line with analysts’ consensus estimates.
Is now the time to buy Hillman? Find out by accessing our full research report, it’s free.
Hillman (HLMN) Q4 CY2025 Highlights:
- Revenue: $365.1 million vs analyst estimates of $372.4 million (4.5% year-on-year growth, 2% miss)
- Adjusted EPS: $0.10 vs analyst estimates of $0.10 (in line)
- Adjusted EBITDA: $57.54 million vs analyst estimates of $56.57 million (15.8% margin, 1.7% beat)
- EBITDA guidance for the upcoming financial year 2026 is $280 million at the midpoint, below analyst estimates of $283.2 million
- Operating Margin: 4.6%, in line with the same quarter last year
- Free Cash Flow Margin: 4.4%, down from 6.3% in the same quarter last year
- Market Capitalization: $1.98 billion
Jon Michael Adinolfi, Hillman's chief executive officer commented: “During 2025, we successfully managed the dynamic tariff environment while driving record top and bottom line results. The Hillman team did a great job this year taking care of our long standing partners and winning new business.
Company Overview
Established when Max Hillman purchased a franchise operation, Hillman (NASDAQ: HLMN) designs, manufactures, and sells industrial equipment and systems for various sectors.
Revenue Growth
A company’s long-term sales performance can indicate its overall quality. Even a bad business can shine for one or two quarters, but a top-tier one grows for years. Regrettably, Hillman’s sales grew at a sluggish 2.6% compounded annual growth rate over the last five years. This fell short of our benchmarks and is a poor baseline for our analysis.
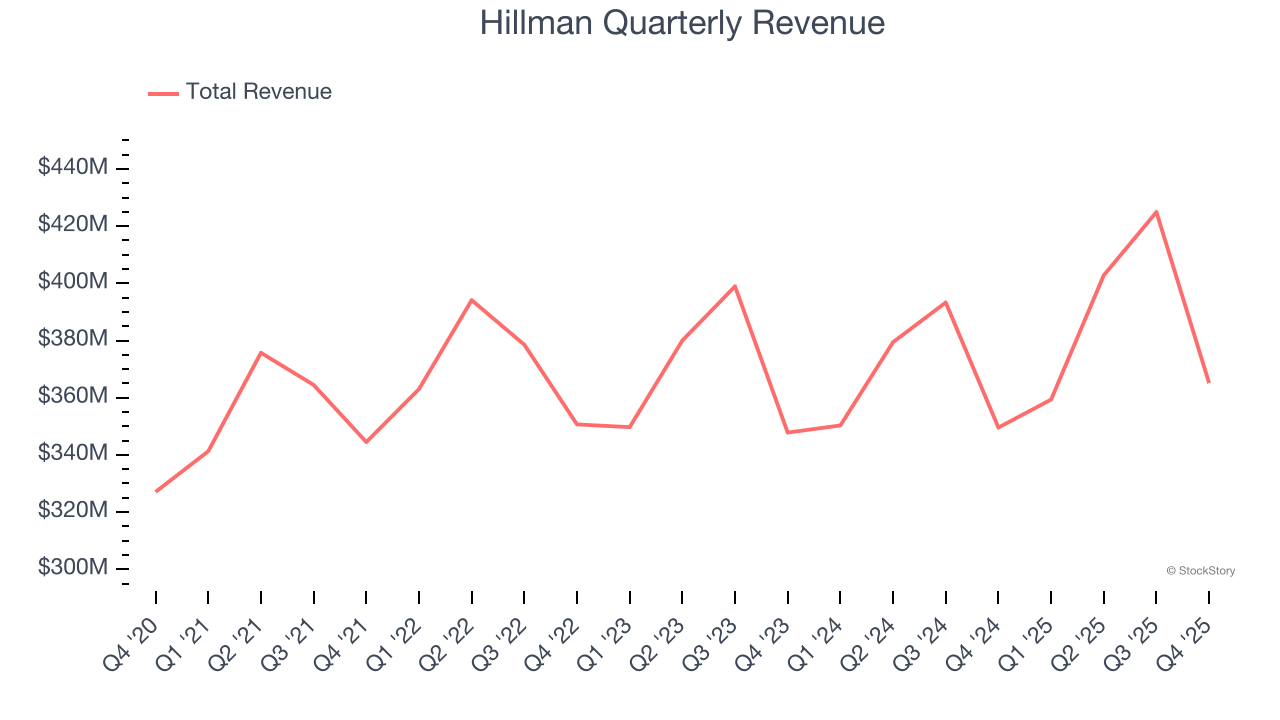
We at StockStory place the most emphasis on long-term growth, but within industrials, a half-decade historical view may miss cycles, industry trends, or a company capitalizing on catalysts such as a new contract win or a successful product line. Hillman’s annualized revenue growth of 2.5% over the last two years aligns with its five-year trend, suggesting its demand was consistently weak. 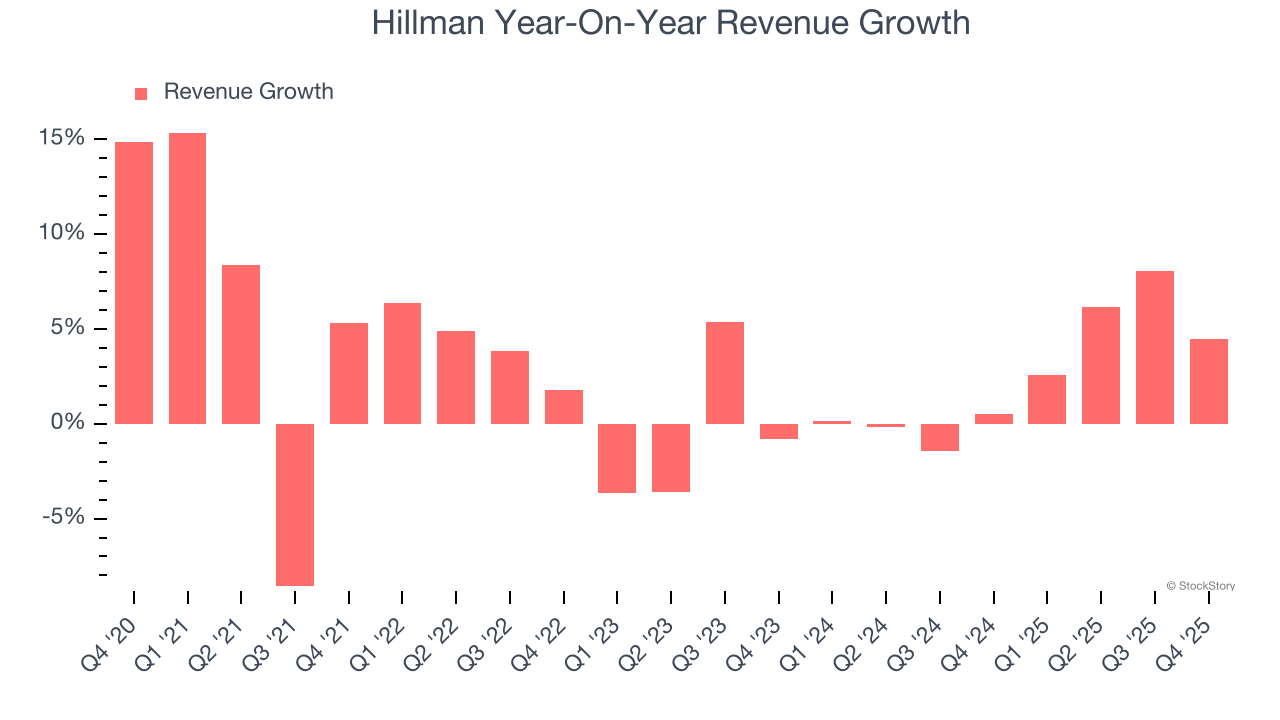
This quarter, Hillman’s revenue grew by 4.5% year on year to $365.1 million, falling short of Wall Street’s estimates.
Looking ahead, sell-side analysts expect revenue to grow 8.2% over the next 12 months, an improvement versus the last two years. This projection is above average for the sector and indicates its newer products and services will catalyze better top-line performance.
Microsoft, Alphabet, Coca-Cola, Monster Beverage—all began as under-the-radar growth stories riding a massive trend. We’ve identified the next one: a profitable AI semiconductor play Wall Street is still overlooking. Go here for access to our full report.
Operating Margin
Hillman was profitable over the last five years but held back by its large cost base. Its average operating margin of 4.2% was weak for an industrials business. This result is surprising given its high gross margin as a starting point.
On the plus side, Hillman’s operating margin rose by 6.6 percentage points over the last five years, as its sales growth gave it operating leverage.
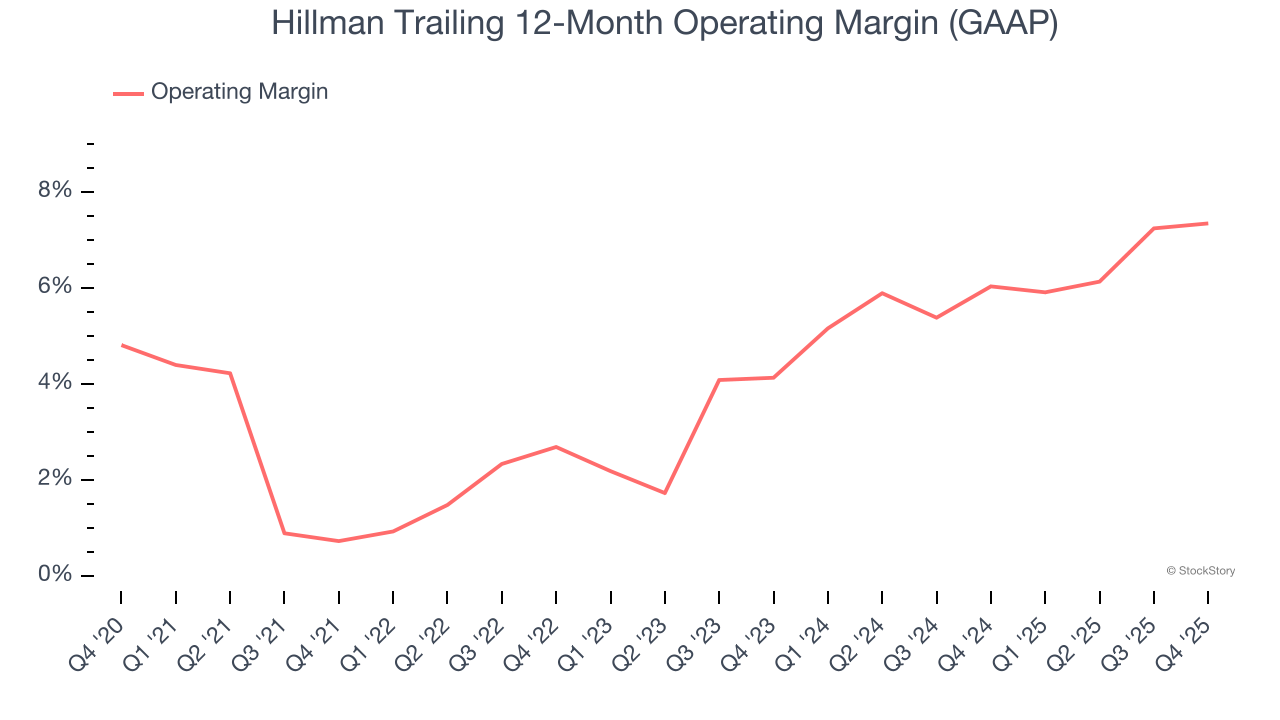
In Q4, Hillman generated an operating margin profit margin of 4.6%, in line with the same quarter last year. This indicates the company’s cost structure has recently been stable.
Earnings Per Share
Revenue trends explain a company’s historical growth, but the long-term change in earnings per share (EPS) points to the profitability of that growth – for example, a company could inflate its sales through excessive spending on advertising and promotions.
Hillman’s full-year EPS grew at an astounding 33.7% compounded annual growth rate over the last four years, better than the broader industrials sector.
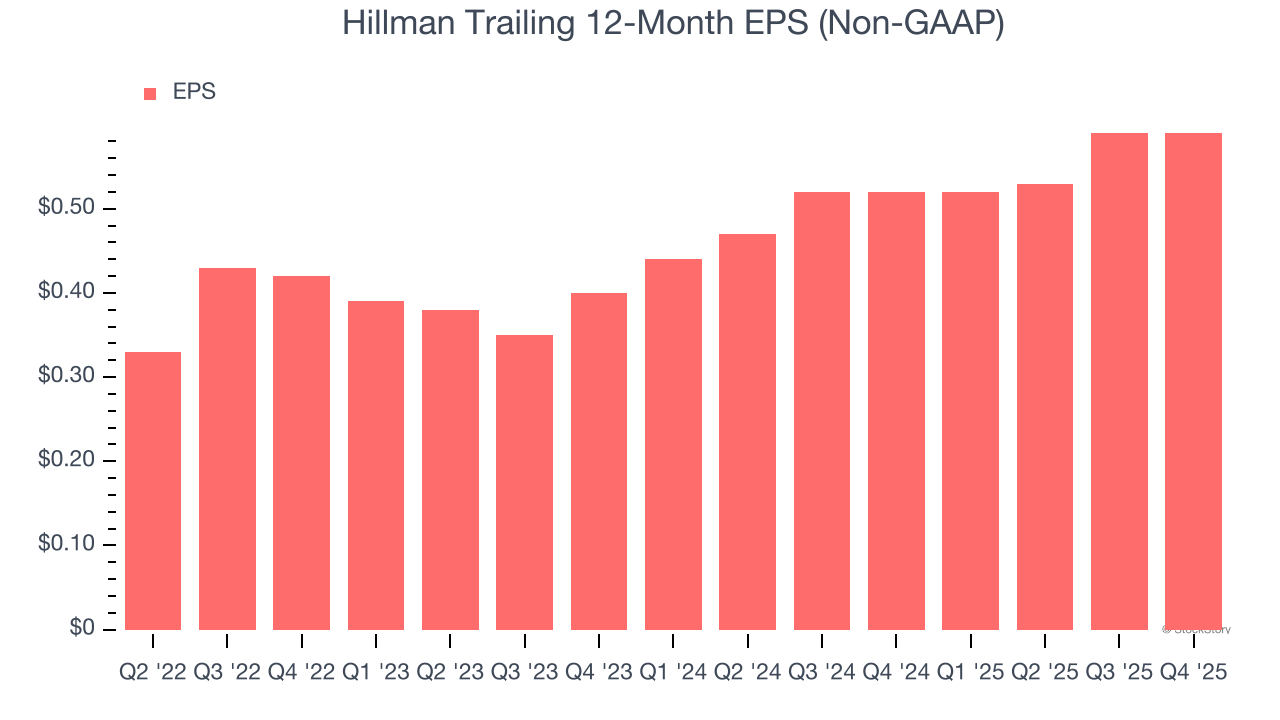
Like with revenue, we analyze EPS over a more recent period because it can provide insight into an emerging theme or development for the business.
Hillman’s EPS grew at an astounding 21.4% compounded annual growth rate over the last two years, higher than its 2.5% annualized revenue growth. This tells us the company became more profitable on a per-share basis as it expanded.
Diving into Hillman’s quality of earnings can give us a better understanding of its performance. While we mentioned earlier that Hillman’s operating margin was flat this quarter, a two-year view shows its margin has expanded. This was the most relevant factor (aside from the revenue impact) behind its higher earnings; interest expenses and taxes can also affect EPS but don’t tell us as much about a company’s fundamentals.
In Q4, Hillman reported adjusted EPS of $0.10, in line with the same quarter last year. This print beat analysts’ estimates by 4.3%. Over the next 12 months, Wall Street expects Hillman’s full-year EPS of $0.59 to grow 1.2%.
Key Takeaways from Hillman’s Q4 Results
It was encouraging to see Hillman beat analysts’ EBITDA expectations this quarter. We were also glad its EPS was in line with Wall Street’s estimates. On the other hand, its revenue missed and its full-year revenue guidance fell short of Wall Street’s estimates. Overall, this quarter could have been better. The stock traded down 4.6% to $9.59 immediately following the results.
The latest quarter from Hillman’s wasn’t that good. One earnings report doesn’t define a company’s quality, though, so let’s explore whether the stock is a buy at the current price. What happened in the latest quarter matters, but not as much as longer-term business quality and valuation, when deciding whether to invest in this stock. We cover that in our actionable full research report which you can read here (it’s free).


