
Environmental waste treatment and services provider Perma-Fix (NASDAQ: PESI) reported Q3 CY2025 results exceeding the market’s revenue expectations, with sales up 3.8% year on year to $17.45 million. Its GAAP loss of $0.10 per share was 16.7% above analysts’ consensus estimates.
Is now the time to buy Perma-Fix? Find out by accessing our full research report, it’s free for active Edge members.
Perma-Fix (PESI) Q3 CY2025 Highlights:
- Revenue: $17.45 million vs analyst estimates of $16.3 million (3.8% year-on-year growth, 7.1% beat)
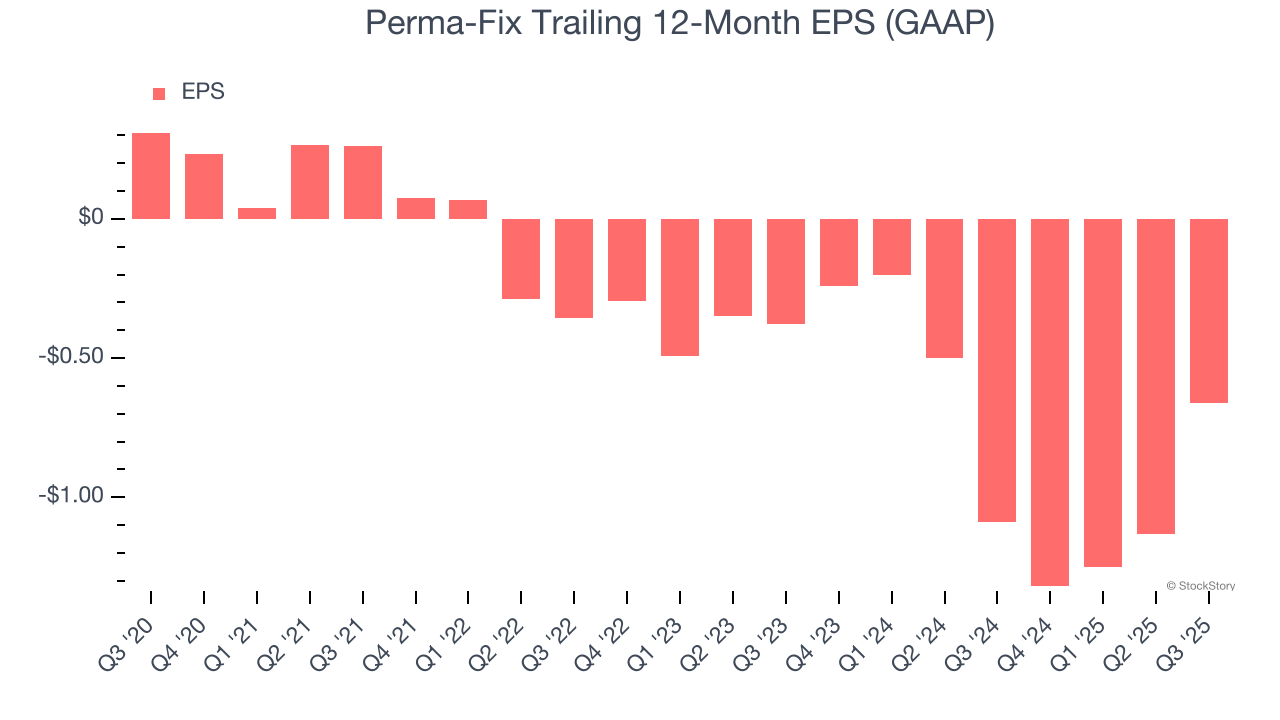
- EPS (GAAP): -$0.10 vs analyst estimates of -$0.12 (16.7% beat)
- Adjusted EBITDA: -$1.46 million vs analyst estimates of -$1.7 million (-8.4% margin, relatively in line)
- Operating Margin: -10.7%, up from -15.5% in the same quarter last year
- Market Capitalization: $237.7 million
Mark Duff, President and Chief Executive Officer (CEO) of the Company, commented, “We are pleased to report improved performance driven by a 45% year-over-year revenue increase and gross margin improvement in our Treatment Segment to 17.3% from 4.5% in the prior year. Higher waste volumes and growing international shipments contributed to improved results, and our treatment backlog continues to build, which we expect will lead to continued improvement through 2026. This growth spans both government and commercial waste streams, further diversifying our customer base and strengthening our overall operating performance.
Company Overview
Tackling hazardous waste challenges since 1990, Perma-Fix (NASDAQ: PESI) provides environmental waste treatment services.
Revenue Growth
A company’s long-term sales performance can indicate its overall quality. Any business can experience short-term success, but top-performing ones enjoy sustained growth for years. Perma-Fix’s demand was weak over the last five years as its sales fell at a 9.4% annual rate. This was below our standards and suggests it’s a low quality business.
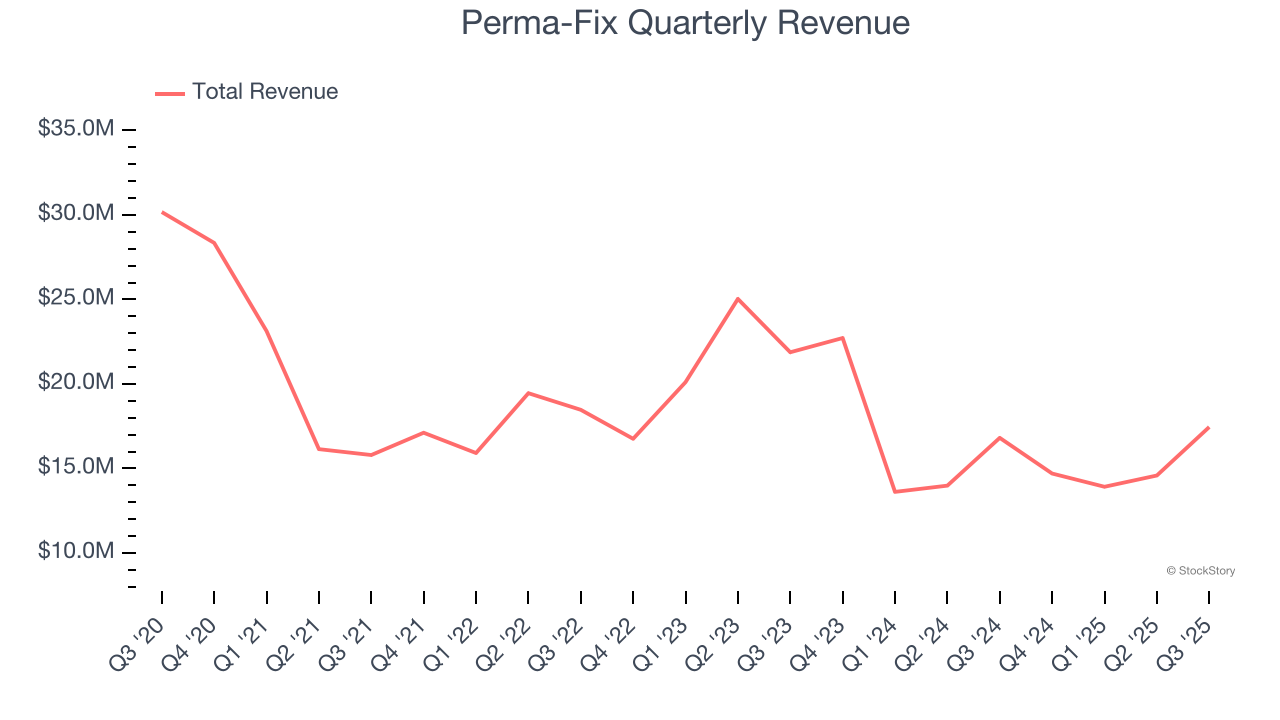
Long-term growth is the most important, but within industrials, a half-decade historical view may miss new industry trends or demand cycles. Perma-Fix’s recent performance shows its demand remained suppressed as its revenue has declined by 14.9% annually over the last two years. 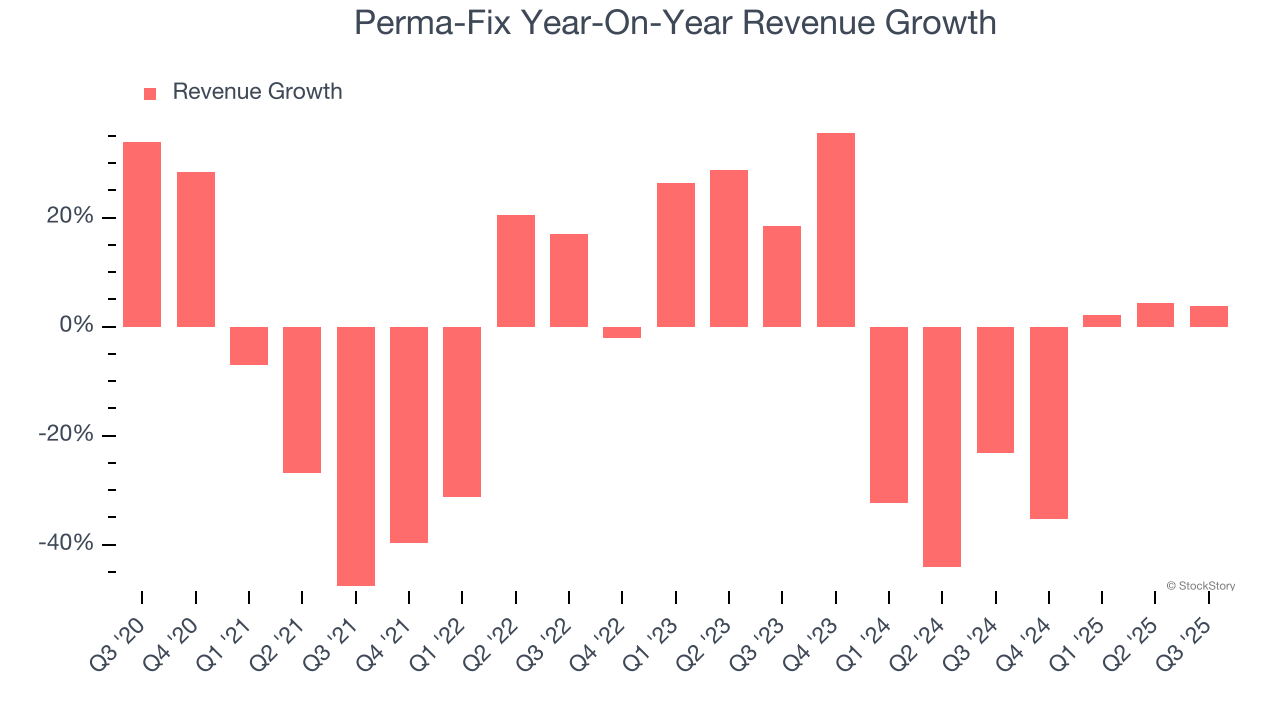
This quarter, Perma-Fix reported modest year-on-year revenue growth of 3.8% but beat Wall Street’s estimates by 7.1%.
Looking ahead, sell-side analysts expect revenue to grow 59.7% over the next 12 months, an improvement versus the last two years. This projection is eye-popping and indicates its newer products and services will catalyze better top-line performance.
Software is eating the world and there is virtually no industry left that has been untouched by it. That drives increasing demand for tools helping software developers do their jobs, whether it be monitoring critical cloud infrastructure, integrating audio and video functionality, or ensuring smooth content streaming. Click here to access a free report on our 3 favorite stocks to play this generational megatrend.
Operating Margin
Perma-Fix’s high expenses have contributed to an average operating margin of negative 9.6% over the last five years. Unprofitable industrials companies require extra attention because they could get caught swimming naked when the tide goes out. It’s hard to trust that the business can endure a full cycle.
Looking at the trend in its profitability, Perma-Fix’s operating margin decreased by 14.7 percentage points over the last five years. Perma-Fix’s performance was poor no matter how you look at it - it shows that costs were rising and it couldn’t pass them onto its customers.

This quarter, Perma-Fix generated a negative 10.7% operating margin. The company's consistent lack of profits raise a flag.
Earnings Per Share
We track the long-term change in earnings per share (EPS) for the same reason as long-term revenue growth. Compared to revenue, however, EPS highlights whether a company’s growth is profitable.
Sadly for Perma-Fix, its EPS declined by 32.8% annually over the last five years, more than its revenue. This tells us the company struggled because its fixed cost base made it difficult to adjust to shrinking demand.
Diving into the nuances of Perma-Fix’s earnings can give us a better understanding of its performance. As we mentioned earlier, Perma-Fix’s operating margin expanded this quarter but declined by 14.7 percentage points over the last five years. Its share count also grew by 49.3%, meaning the company not only became less efficient with its operating expenses but also diluted its shareholders. 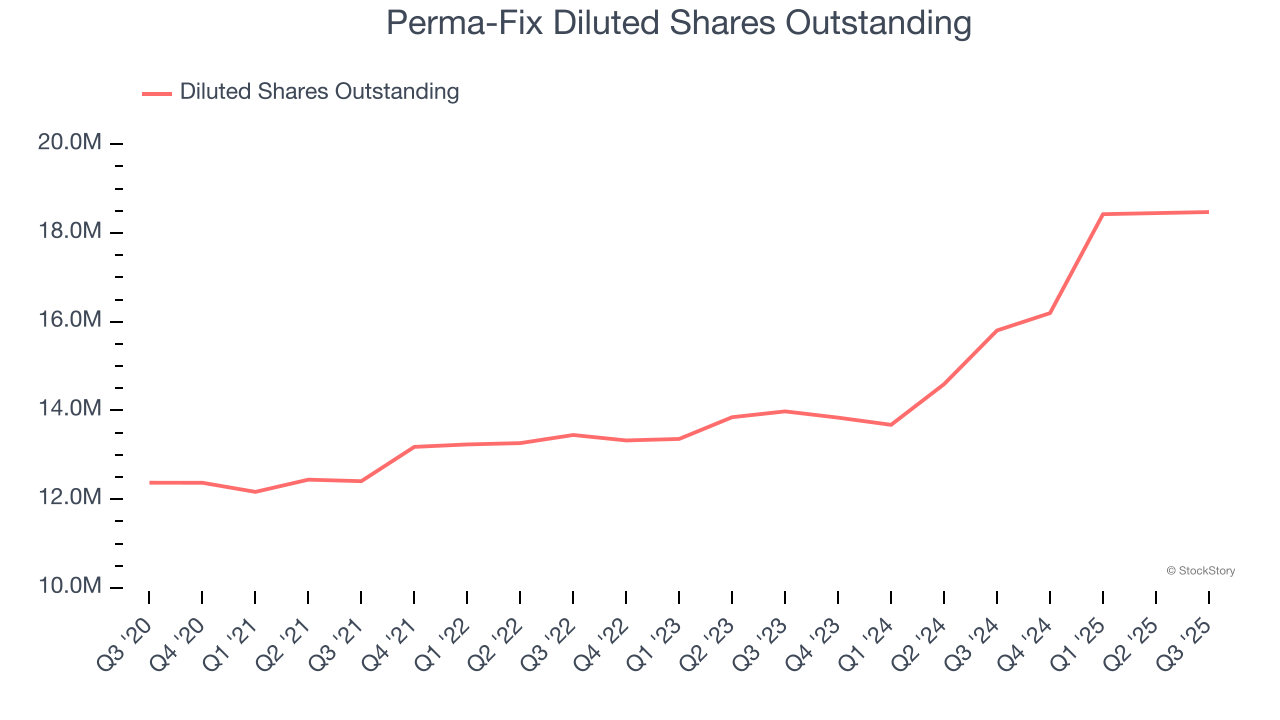
Like with revenue, we analyze EPS over a shorter period to see if we are missing a change in the business.
For Perma-Fix, its two-year annual EPS declines of 32.3% are similar to its five-year trend. These results were bad no matter how you slice the data.
In Q3, Perma-Fix reported EPS of negative $0.10, up from negative $0.57 in the same quarter last year. This print easily cleared analysts’ estimates, and shareholders should be content with the results. Over the next 12 months, Wall Street is optimistic. Analysts forecast Perma-Fix’s full-year EPS of negative $0.66 will flip to positive $0.16.
Key Takeaways from Perma-Fix’s Q3 Results
We were impressed by how significantly Perma-Fix blew past analysts’ revenue expectations this quarter. EPS also managed to come in ahead of Wall Street’s. Zooming out, we think this was a solid print. The stock remained flat at $12.87 immediately following the results.
Should you buy the stock or not? When making that decision, it’s important to consider its valuation, business qualities, as well as what has happened in the latest quarter. We cover that in our actionable full research report which you can read here, it’s free for active Edge members.


