Valuation: Projections behind the magic
All investments are worth the present value of all future cash flows, a saying I can repeat until I am blue in the face. In the case of Anhui Conch, we can take a look at the following projections to derive such cash flows:
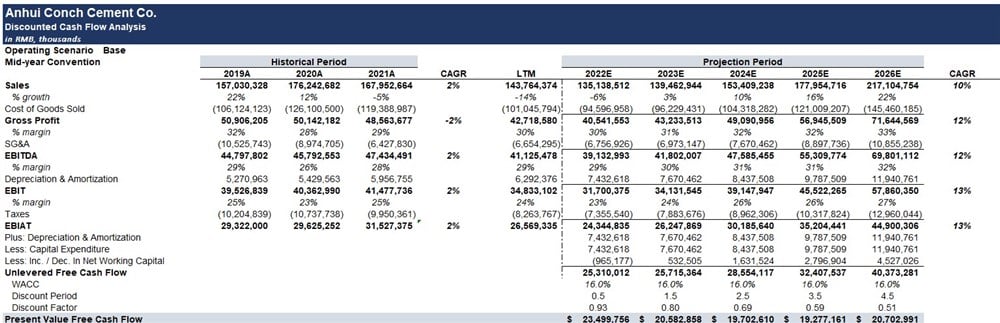
- Considering a possible slowdown in infrastructure spending worldwide and lower production of cement while excess inventory moves to match adjusted demand. Shown in Revenue slowdown through 2023
- This contraction in revenue could translate to more competitive pricing in order to stimulate demand, clean excess inventory, and thus spark a new production phase. Shown in Gross Margin / EBIT margin contraction through 2023
- Increased safety margins are included in the final assessment of cash flows (Present Value Free Cash Flow), considering lower-liquidity in OTC markets and China geopolitical risks. Shown in a 16% discount rate vs a calculated cost of capital of 8%
All said and done, these assumptions and projections will yield a DCF (Discounted Cash Flows) valuation of $40 USD per share.
Are these prices reasonable?
For the sake of running a sanity test, we ask the question "are these assumptions crazy?". As we all know, meme-stock markets aren't the norm.
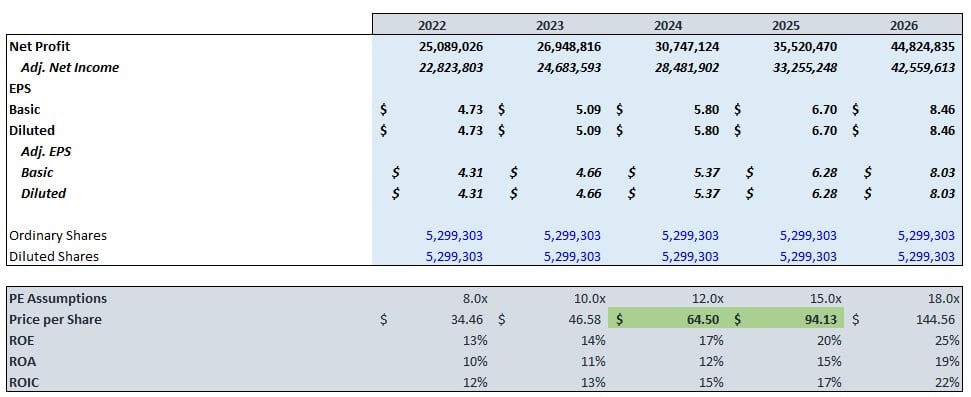
- Focusing specifically on projected Net Income and EPS (keeping shares outstanding the same despite management pointing to buybacks), the years FY2024E and FY2025E come into focus.
- For these years we apply reasonable P/E multiples of 12x and 15x yielding a price (in RMB) per share of $65.50 and $94.13. This translates to $42.58 and $61.2 USD per share.
To Pay or Not to Pay
Now that we understand what this company could be worth, could investors time a better possible purchase? Value investors understand that timing the market is a painful and often times catastrophic venture. However, industry titans like Warren Buffett, Mohnish Pabrai, Seth Klarman and others advocate for keeping cyclicality in mind when buying or selling a business.
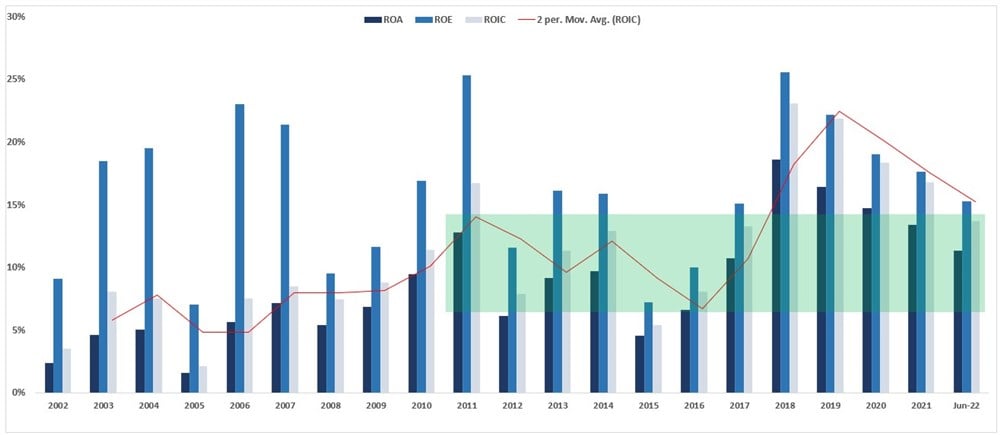
- Commodity-based businesses, such as Anhui Conch, are highly cyclical in their margins and ROIC (Return on Invested Capital) metrics. Keeping this in mind, investors would benefit by assessing the current state of these metrics when considering a purchase.
- Our target stands at a 5-year low in all of these return metrics, providing a sane conclusion that investors may be presented with the chance of buying this highly profitable business at the near-bottom of the cycle.
- It should be noted, however, that in the 2014-2016 commodity crisis these metrics declined to sub-10% levels as seen above. Therefore, investors should be wary of the same scenario - or worse - repeating shall our timing be mistaken.
More metrics pointing to Cyclicality:
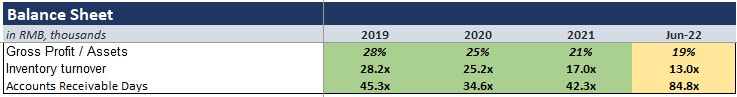
- Gross Profit / Assets can be interpreted in many ways. However, the prevailing view is that competitive pricing of inventory and excess inventory, is driving this ratio to a 4-year low.
- Inventory turnover has also declined to a 4-year low, poising an underlying tailwind to boost sales.
- Accounts receivable has doubled from its usual norm, signaling customer difficulty in making payments in the face of a global economic tightening cycle. This also poses a tailwind to boost income even after revising for write-offs in these accounts.
As a final note on the purchase margin of safety, the following calculation may come in handy:
The business has total assets (net of debt and goodwill) valued at
RMB 195,253,961
Dividing this value by the total shares outstanding of 5,299,303 and converting from RMB to USD, we arrive at a NAV per share value of $25.50
Buying this stock below the above conclusion would imply a near-risk-free scenario for common equity holders.
Technical Analysis and Expectations
- Stock is currently trading in the 61.8% to 78% Fibonacci level, also known as the "Golden Ratio"
- Just proved strong support and demand zones at the $13-$15 range, pushed by a weekly RSI breakout from "oversold"
- Recent Downtrends in Stochastics, MACD, and RSIs on weekly charts provide reasonable expectations for investors to purchase at better prices, namely the $13-15 range mentioned above.
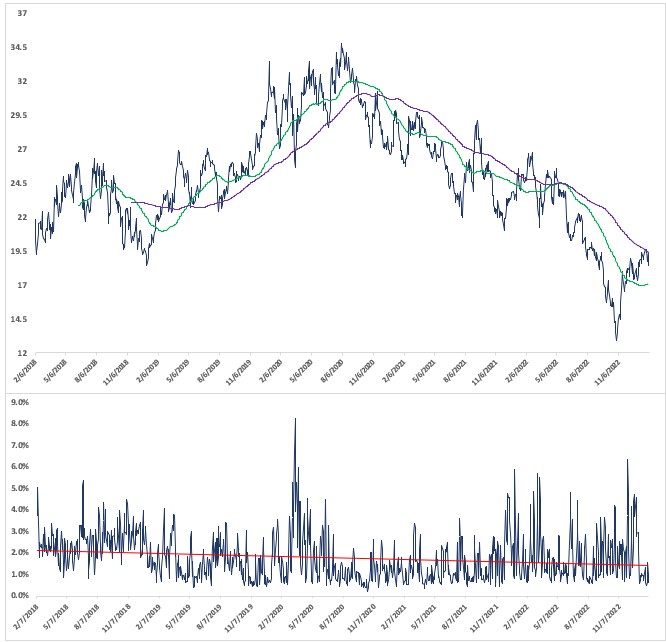
The above image provides a conclusion to the technical timing of volatility. The top chart represents the stock price and its recent advance, with an almost mirror image of compressed volatility in the bottom chart.
There is reason to believe, mainly through catalysts in Chinese economic data and/or announcements in the company, that investors can expect a volatility breakout causing the price to decline. Ideally, this decline will bring us into the $13-$15 range where a purchase may be more sensible to avoid further price structure declines.
Investing in Anhui Conch Cement
Investors can virtually buy this business below NAV; however, as shown above, in the cyclicality and volatility breakout section, it would be prudent to wait for lower prices in the $13-$15 range. There are strong reasons to believe buyers can see upsides to the $40 and $60 range, as long as cooler heads prevail in the face of OTC market volatility and often low liquidity in entry-exit.