Schlumberger Limited (SLB) stands as a preeminent global oilfield services company, demonstrating proficiency in construction, production enhancement, and digital solutions. The company offers tech services to the energy industry globally.
During its third quarter, SLB reported Non-GAAP EPS of 78 cents, modestly surpassing projections. Contrarily, its revenue of $8.31 billion fell slightly short of predictions.
SLB’s commitment to shareholder returns is clearly evidenced by its history of consistent dividend payments, an aspect that significantly attracts investors.
Nonetheless, its worth noting that over the last five years, SLB’s dividend payouts have experienced a decline at a CAGR of 12.9%.
While a history of consistent dividends speaks volumes about the company's dedication to shareholders, negative growth rates in dividends over the past few years warrant caution.
Additionally, the company's profitability has been underperforming compared to its competitors, potentially a red flag for long-term investors. Its trailing-12-month gross profit margin stands at 19.79%, which is 57.5% lower than the industry average of 46.52%.
To gauge SLB's potential accurately, investors should hold off until the release of upcoming financial reports and closely follow industry trends. A meticulous analysis of some of its core performance indicators could be illuminating.
Schlumberger N.V.'s Financial Journey: A Quantitative Exploration from March 2021 to September 2023
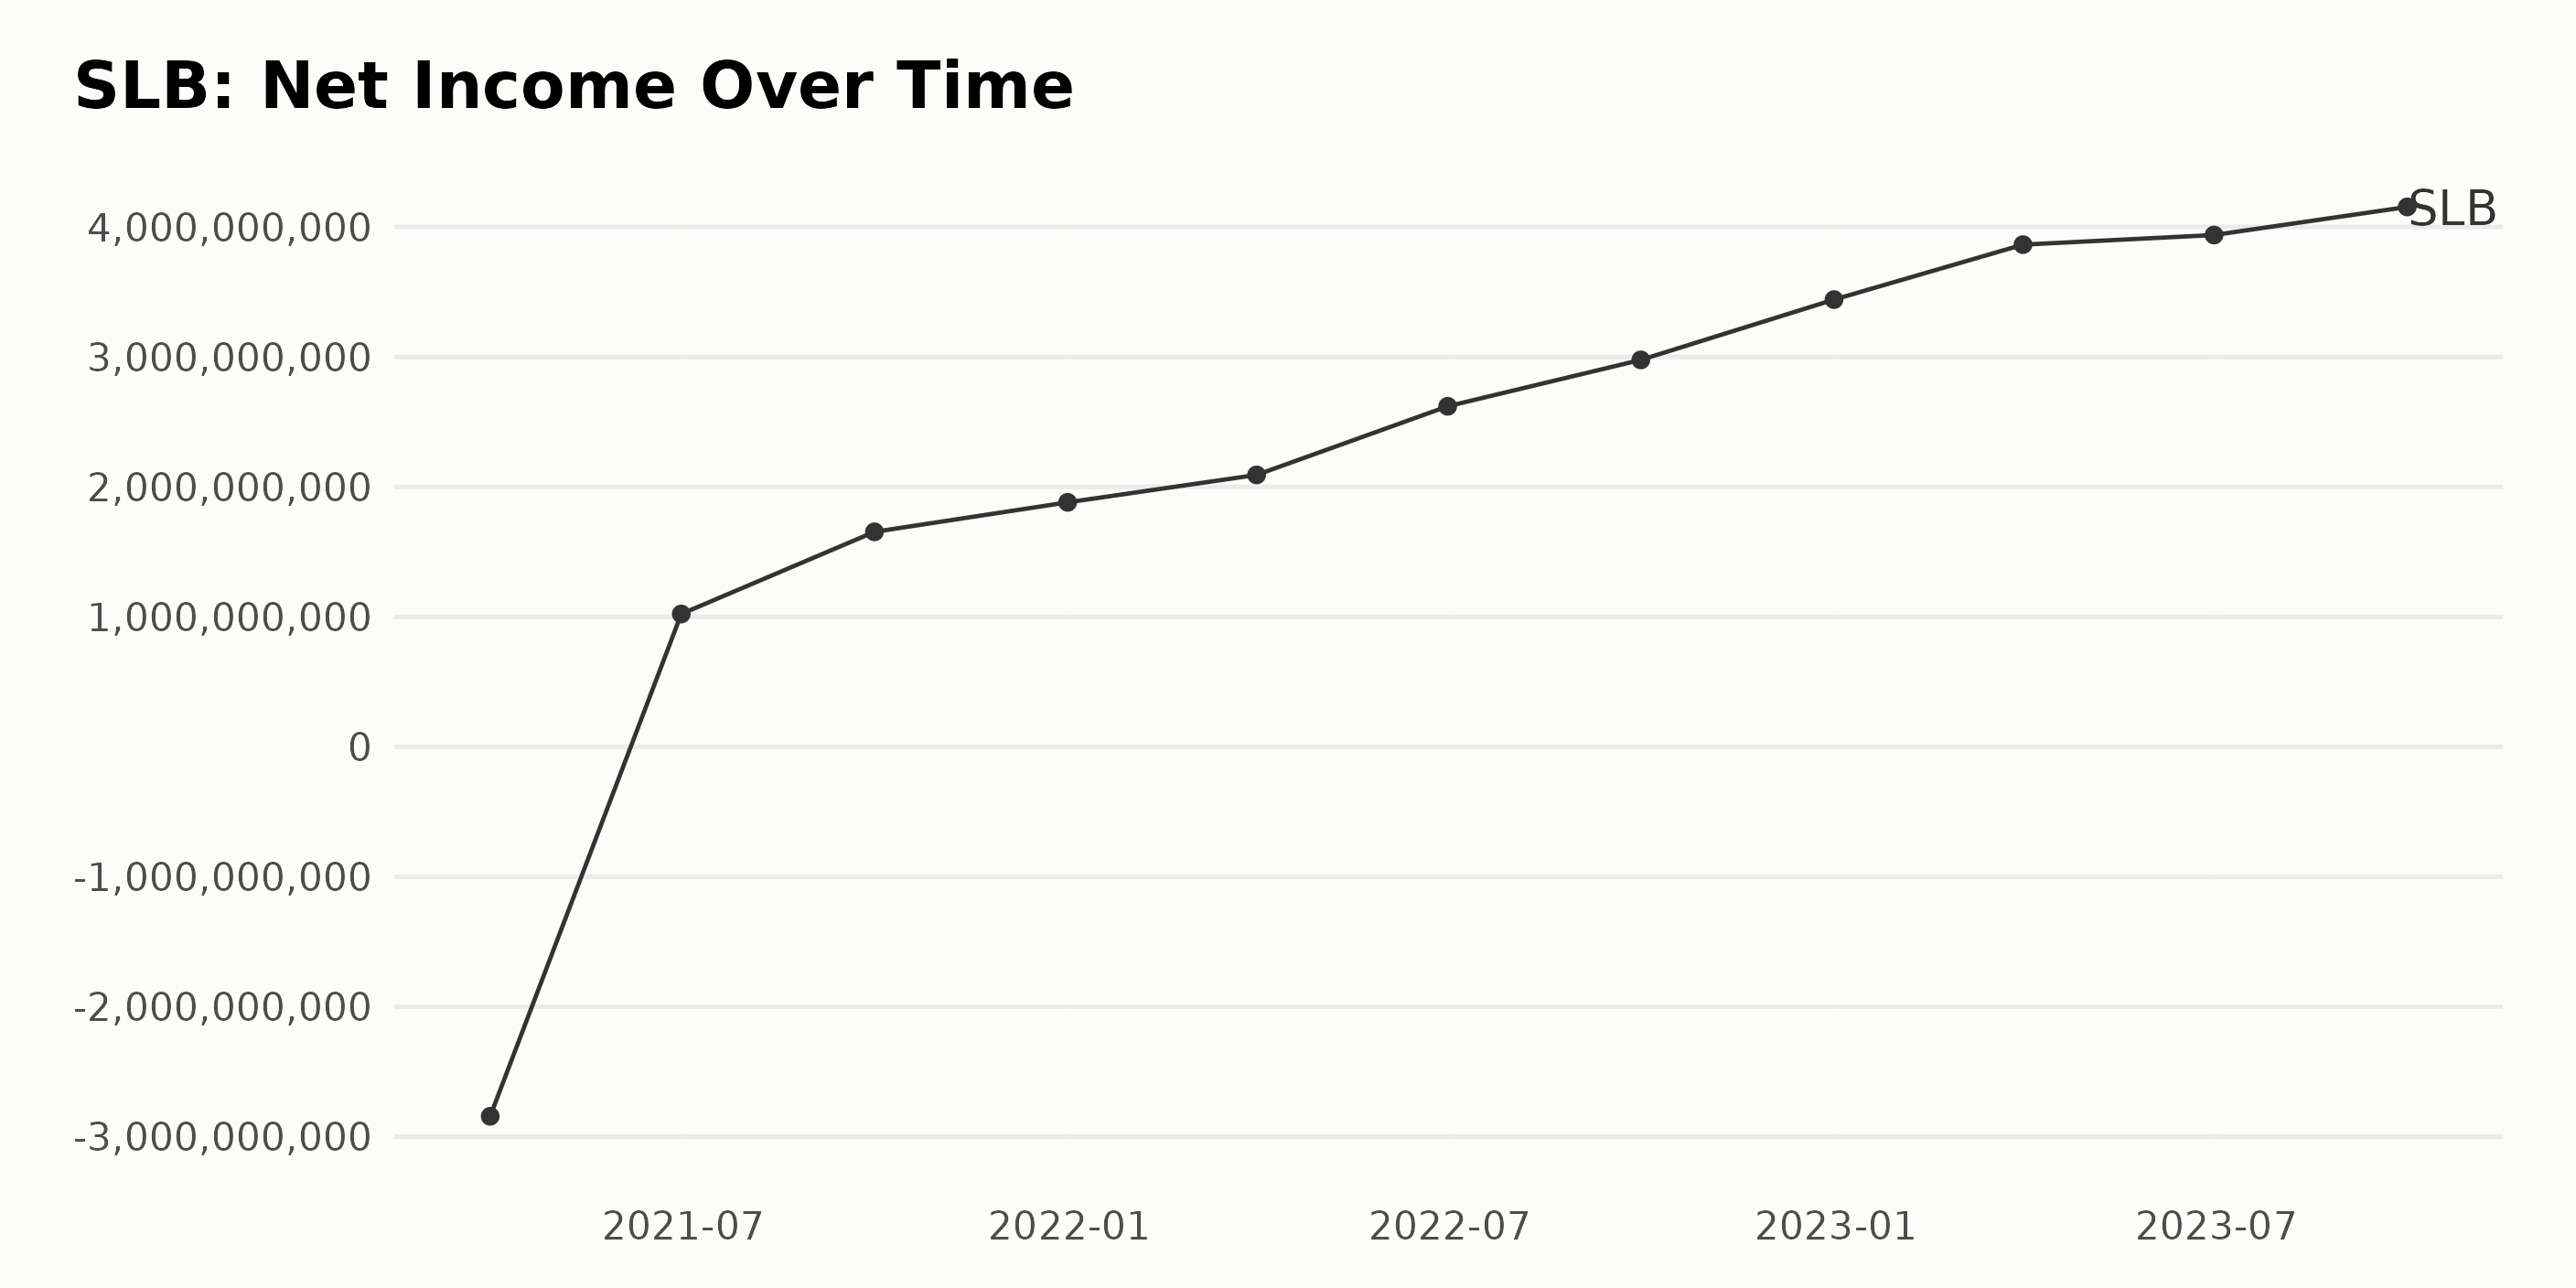
SLB’s trailing-12-month Net Income illustrated a considerable increase from March 2021 to September 2023. Here is an analysis of the fluctuating net income values:
- On March 31, 2021, SLB reported a loss of -$2.84 billion.
- Three months later, on June 30, 2021, the net income was in profit territory at $1.02 billion.
- Net income kept rising each quarter throughout 2021 and 2022, reaching $3.44 billion by the end of 2022.
- In the first three quarters of 2023, net income continued its growth, reaching $4.15 billion by the end of September 2023.
Looking at these figures, we see a shift from a loss position in early 2021 to a strong positive trend in net income by September 2023. The increasing trend suggests a healthy financial posture for SLB in the observed period. The growth rate, calculated as the proportionate increase in net income from the first value ($-2.84 billion) to the last value ($4.15 billion), was dramatic. It showed a strong reversal from losses to robust profitability. The more recent data, particularly the $4.15 billion net income in September 2023, commands more attention. This figure represents the zenith of SLB’s net income during this period.
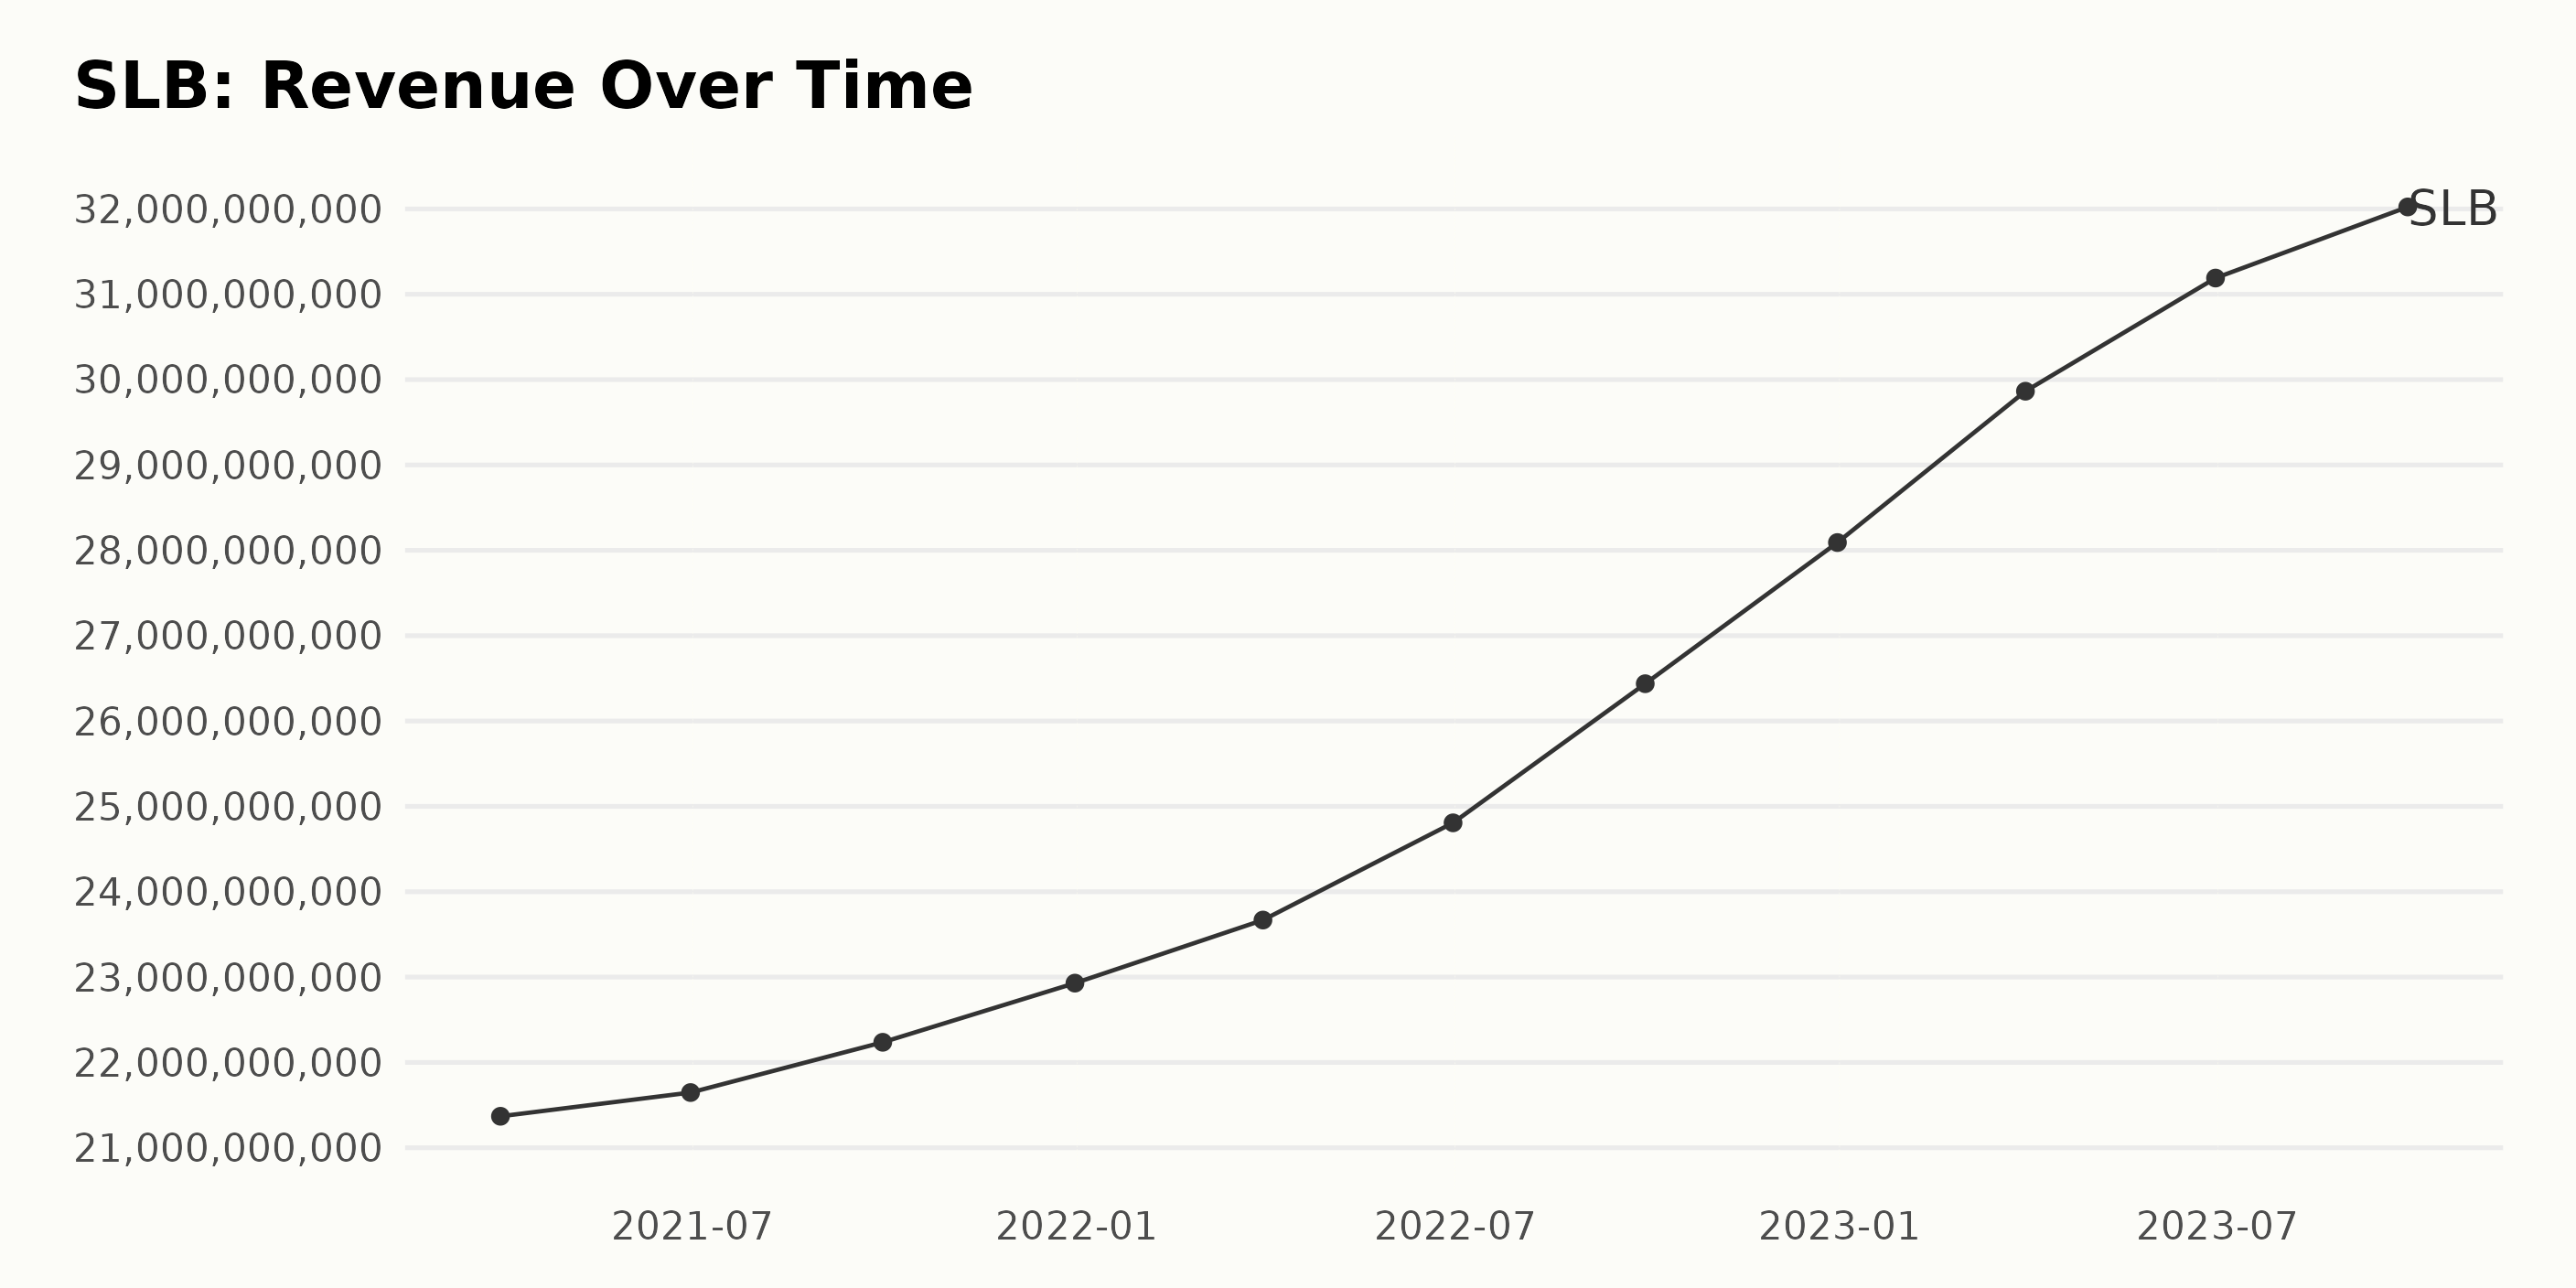
The trailing-12-month revenue of SLB has displayed a consistent upward trend over the reported time span ranging from March 2021 to September 2023. Starting from $21.37 billion in March 2021, the Revenue has grown to $32.02 billion by September 2023. Here's a summarised timeline of Revenue fluctuations:
- March 2021: $21.37 billion
- June 2021: $21.65 billion
- September 2021: $22.24 billion
- December 2021: $22.93 billion
- March 2022: $23.67 billion
- June 2022: $24.81 billion
- September 2022: $26.44 billion
- December 2022: $28.09 billion
- March 2023: $29.86 billion
- June 2023: $31.19 billion
- September 2023: $32.02 billion
The growth rate is calculated here by comparing the last value with the first value. By this measurement, Schlumberger N.V.'s Revenue has experienced a growth rate of approximately 50% over the period. It's worth highlighting that the largest quarterly increase appeared to occur between March and June 2023.
However, placed greater emphasis on the most recent data, it is observed that the growth rate seems to have modestly tapered down in the third quarter of 2023 to around 2.7%, which is lower than the average growth rate across this period.
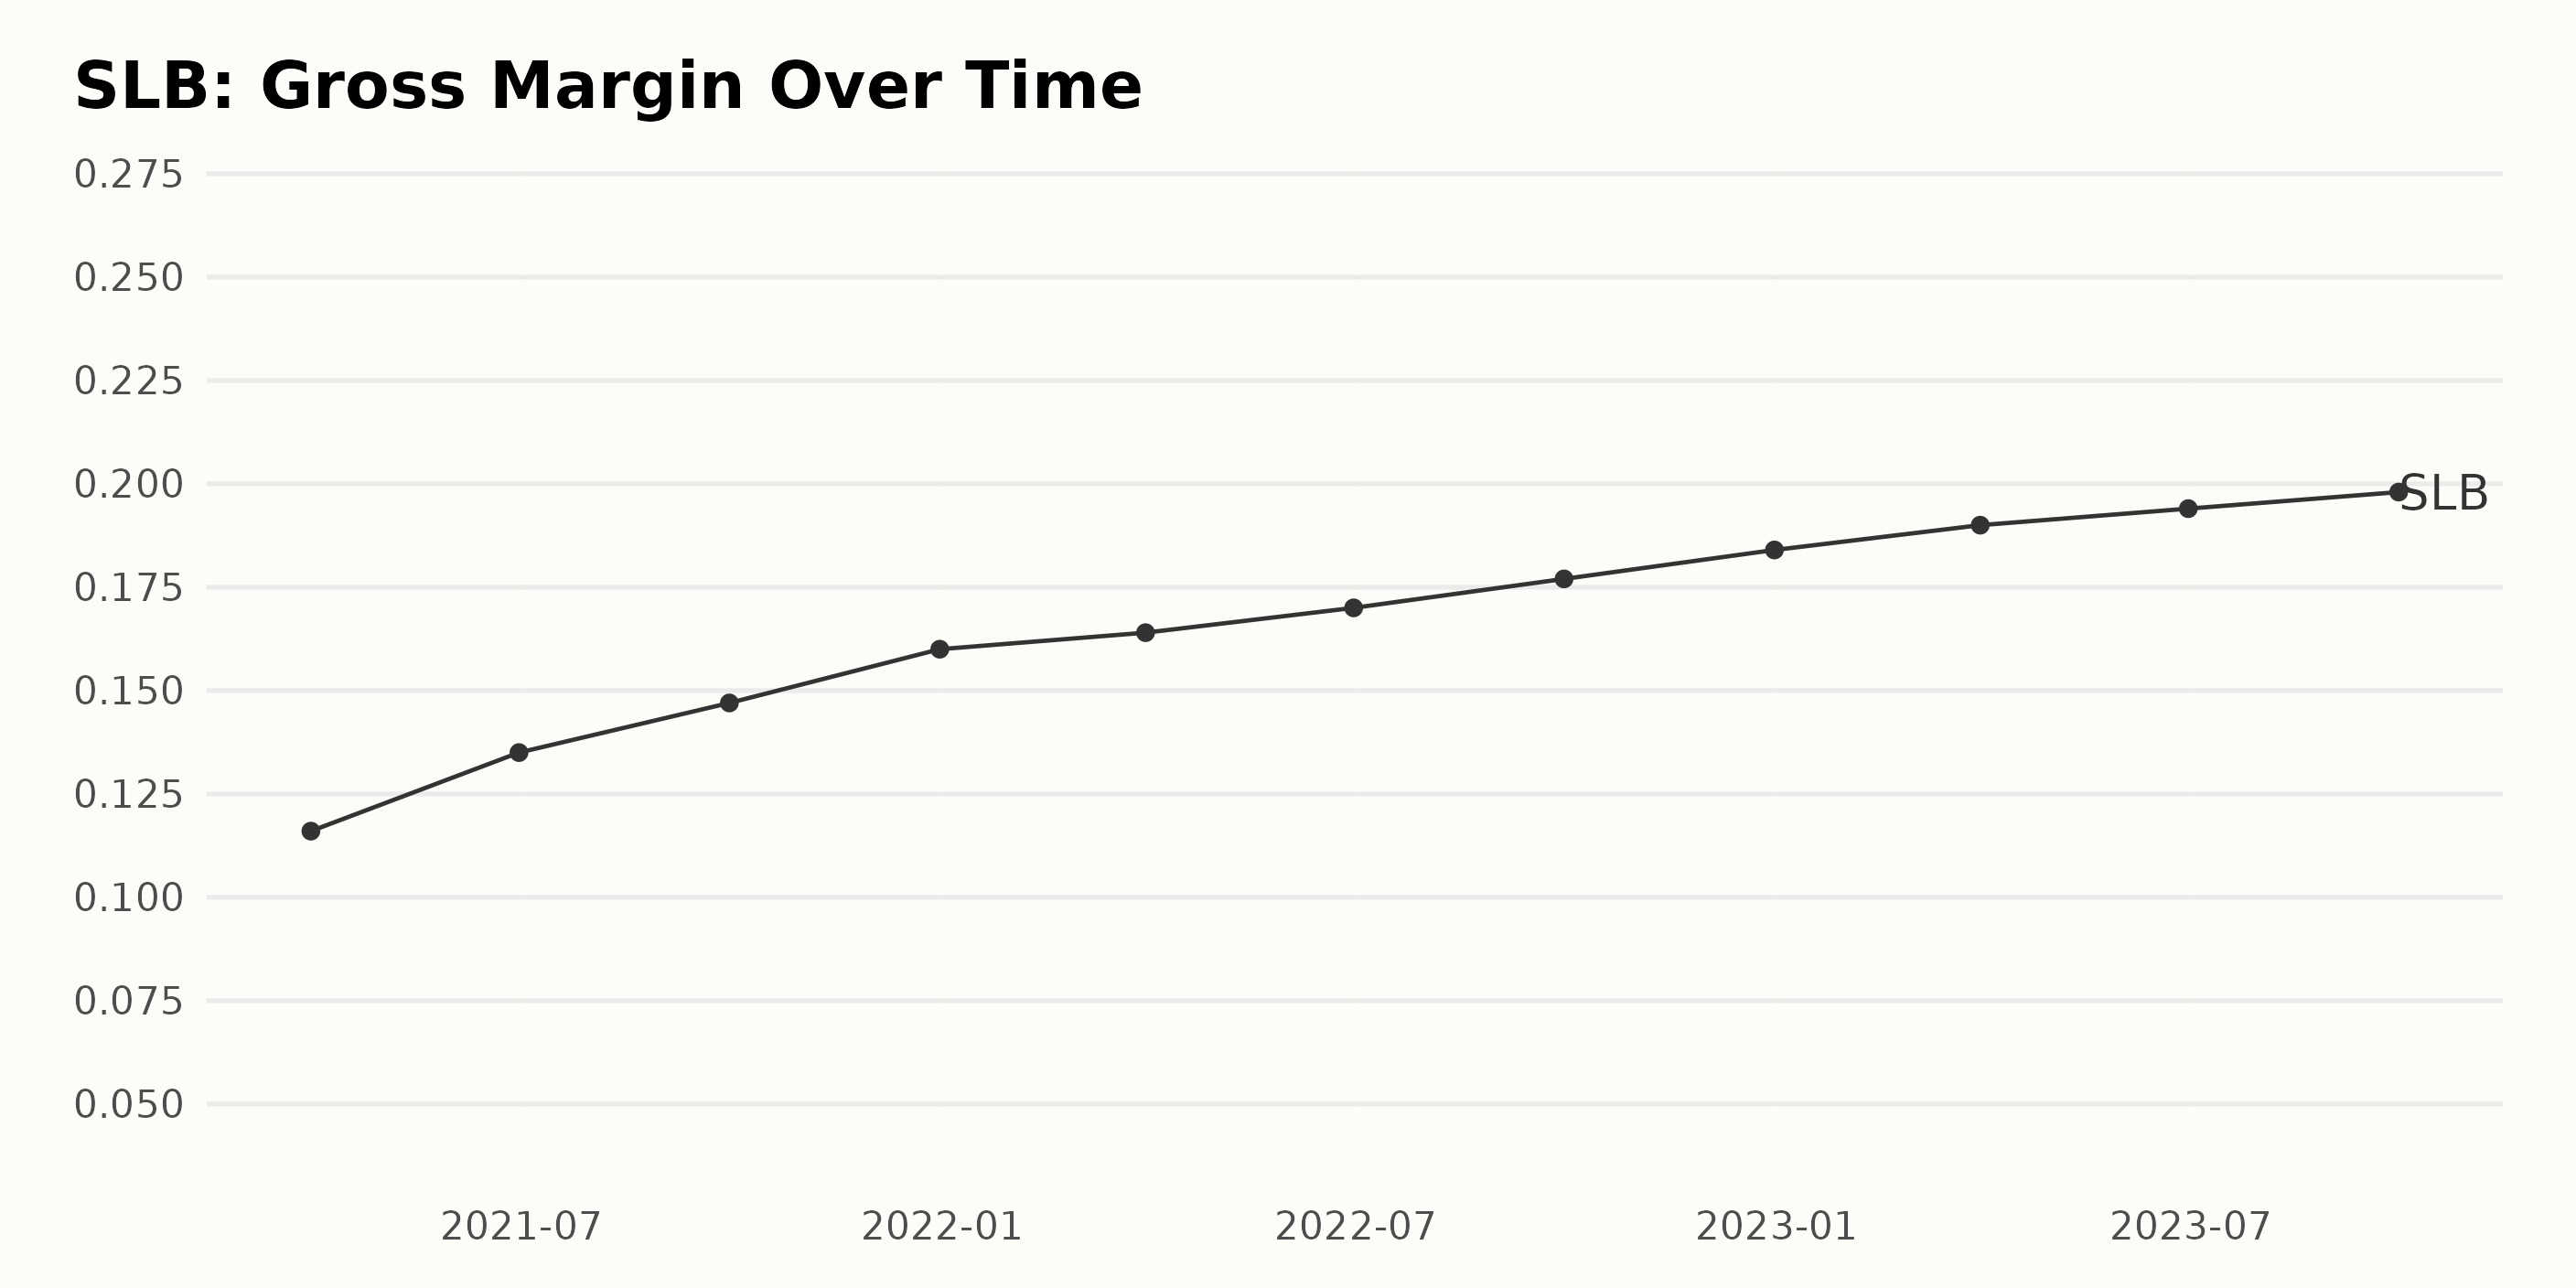
The Gross Margin of SLB has shown a steady uptrend over the data series from March 2021 to September 2023.
- The Gross Margin stood at 11.6% as of March 31, 2021.
- By the end of the second quarter of 2021 (June 30, 2021), it had increased to 13.5%, representing a growth of 1.9 percentage points (pp).
- It continued its upward movement, reaching 14.7% by end of the third quarter of 2021 (September 30, 2021).
- By the end of 2021 (December 31, 2021), the Gross Margin further grew to 16%.
- In the first quarter of 2022 (March 31, 2022), there was a mild increment to 16.4%. The pace picked up in the second quarter (June 30, 2022) with the margin standing at 17%.
- Third quarter 2022 (September 30, 2022) saw another increase, bringing the gross margin to 17.7%. It continued this path to reach 18.4% by end of 2022 (December 31, 2022).
- Into 2023, the margin was at 19% by end of the first quarter (March 31, 2023) and 19.4% by mid-year (June 30, 2023).
- The most recent data, as of end the third quarter 2023 (September 30, 2023), shows the Gross Margin at 19.8%.
This reflects a steady overall growth of 8.2 pp from March 2021 to September 2023 with no notable fluctuations, the growth was rather smooth and consistent. Most of this growth was realized in the early quarters, but the data shows a continual upward trend throughout, indicating a consistently improving performance for Schlumberger’s Gross Margin.
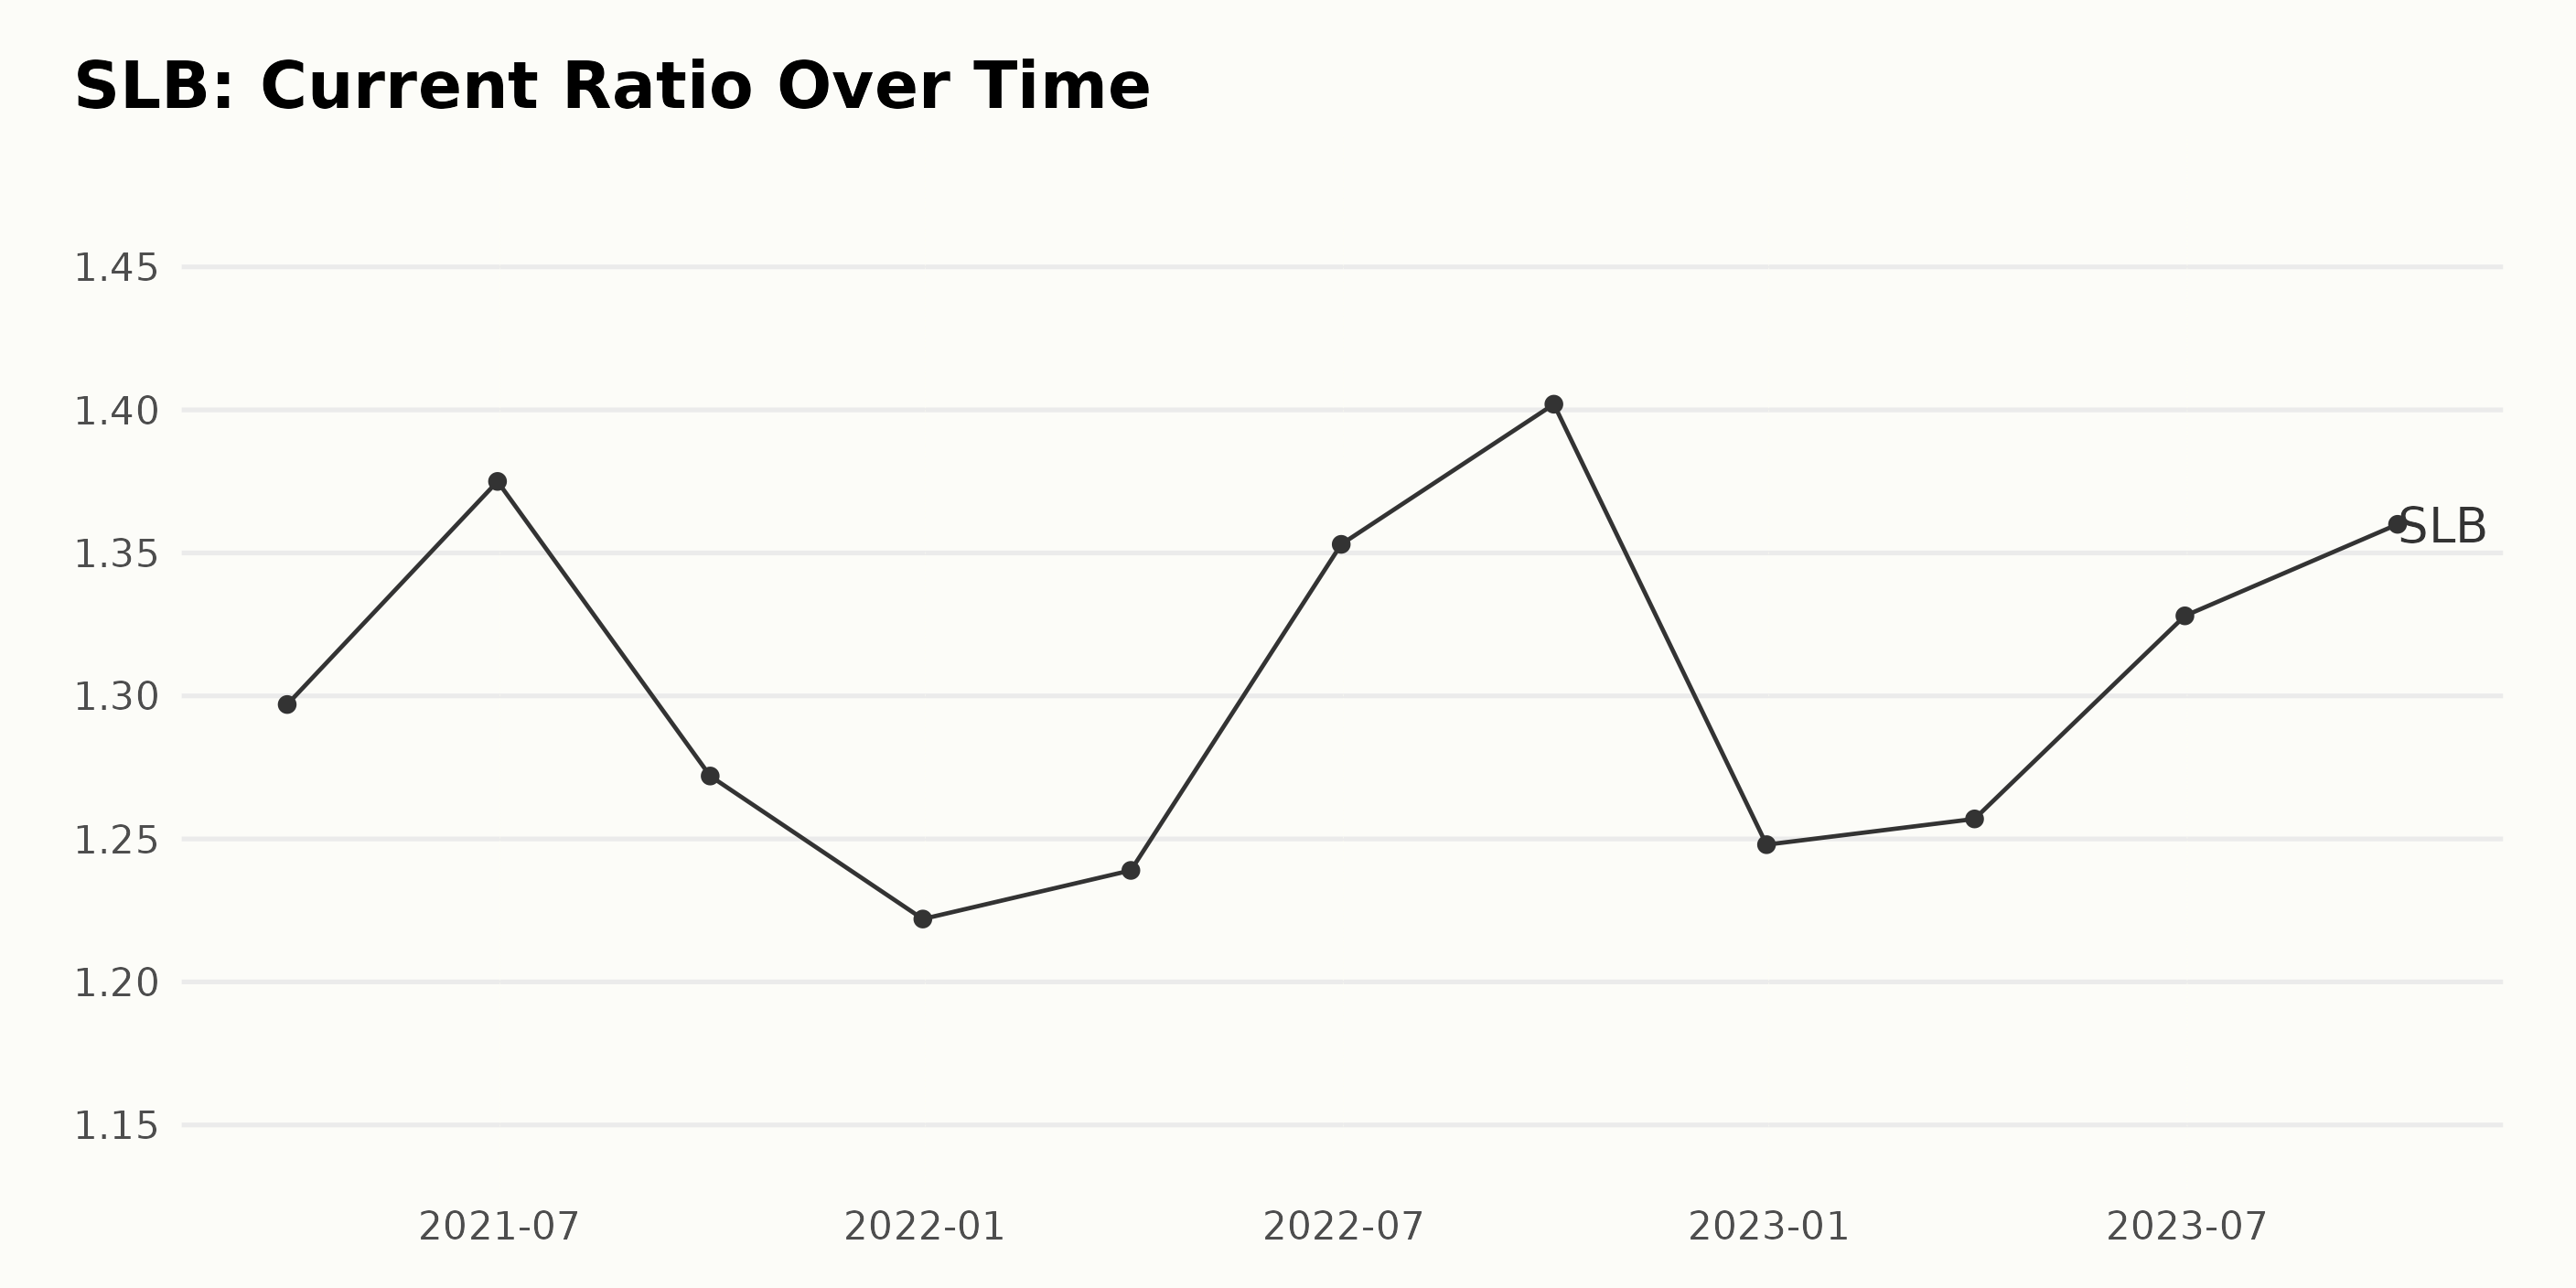
The Current Ratio for SLB experienced notable fluctuations throughout the data series spanning from March 2021 to September 2023.
- SLB began with a Current Ratio of 1.30 in March 2021.
- The highest Current Ratio appeared at 1.40 in September 2022, representing a peak within the observed period.
- However, this ratio took a downturn towards the end of 2022, reclining to 1.25 in December 2022.
- Despite prior fluctuations, we see a more stable trend in 2023, as the ratio marginally increases from 1.26 in March 2023 and stabilizes at 1.36 by September 2023.
If we calculate the growth of the Current Ratio by measuring the first and last values in this series, we can see that there's a growth rate of approximately 4.6%. In conclusion, while Schlumberger N.V.'s Current Ratio demonstrated variability across this period, the final observations suggest a move towards relative stability and moderate growth by the end of the data series. This reflects the company's fluctuating short-term liquidity position and changes in current assets and liabilities over time.
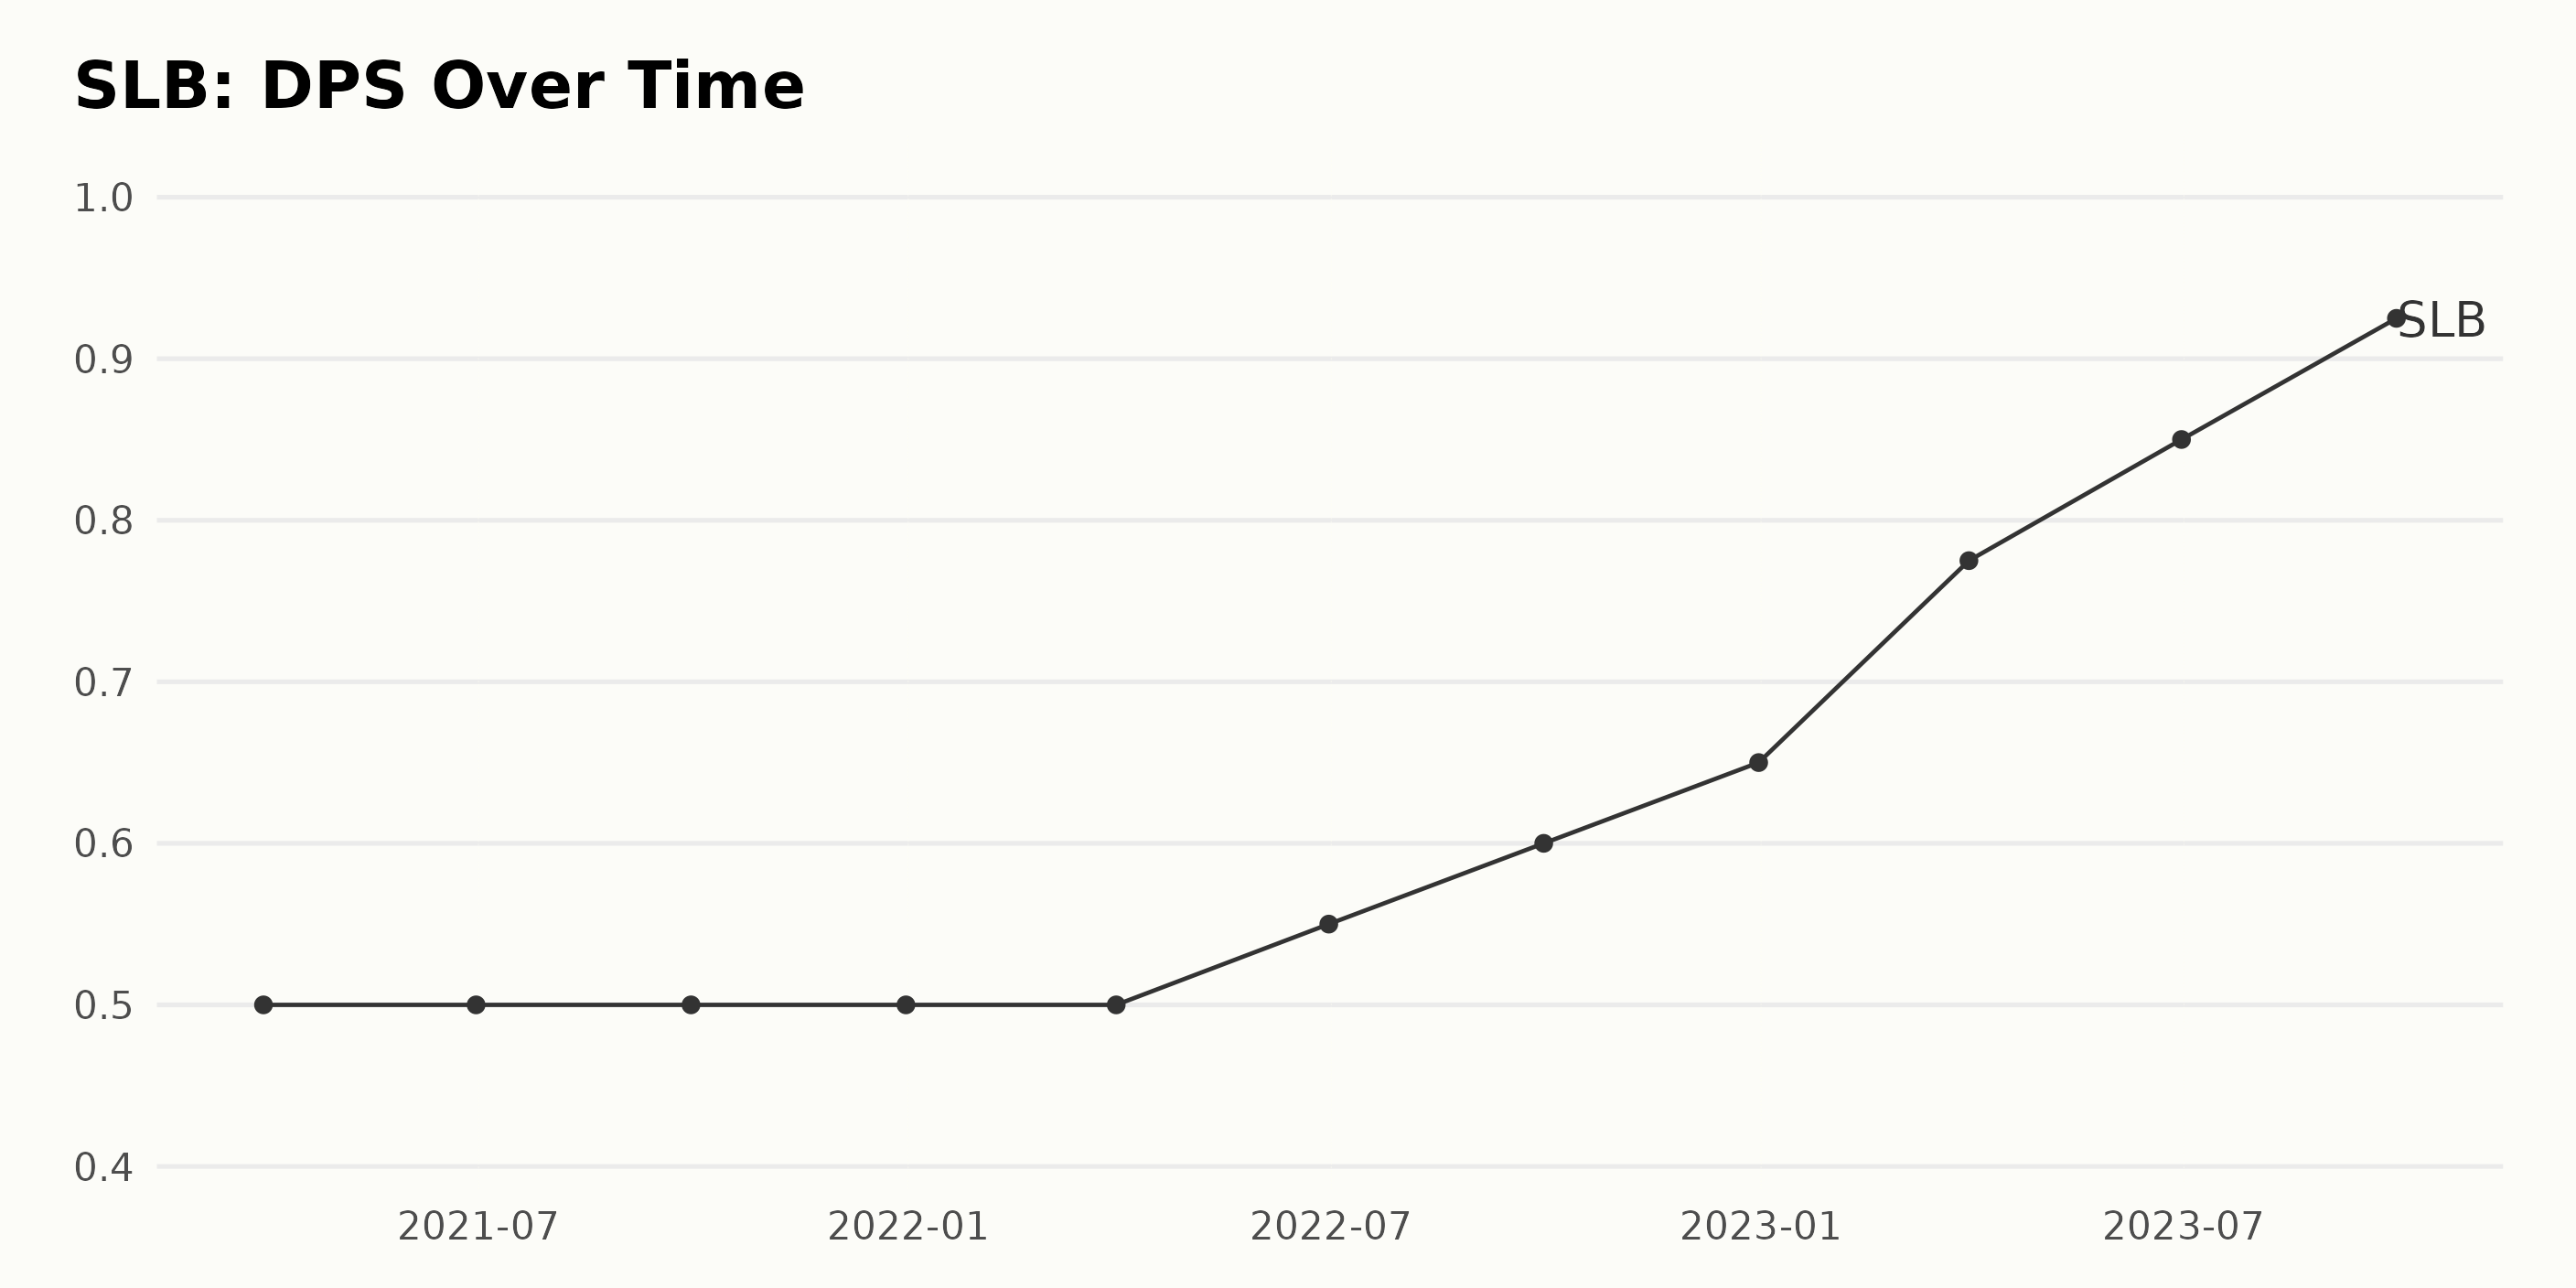
The reported DPS of SLB has shown an increasing trend over the given timeline. Throughout the year 2021, the company's DPS remained stable at $0.50. However, in the subsequent years, SLB demonstrated a consistent growth. Here is a closer look at the significant trends and fluctuations:
- Throughout 2021, specifically from March to December, the DPS remarkably remained steady at $0.50.
- There was a slight increase in DPS in June 2022 when it moved up to $0.55.
- Furthermore, by the end of 2022, the DPS had grown to $0.65, indicating a continuation of the upward trend.
- Notably in 2023, there was a substantial surge in the DPS. By March, it had elevated to $0.775.
- The highest point was reached in September 2023 where the DPS stood at $0.925, showing substantial growth.
Emphasizing the most recent data, the DPS exhibited a consistent increase throughout 2022 and a more pronounced upward trend in 2023. As of the last reported value in September 2023, the DPS stands at $0.925. Calculating from the first value in March 2021 to the last in September 2023, this represents a sizable growth rate of 85%.
Schlumberger N.V. Share Price: A Detailed Analytic Overview of Six-Month Trend (July 2023 - January 2024)
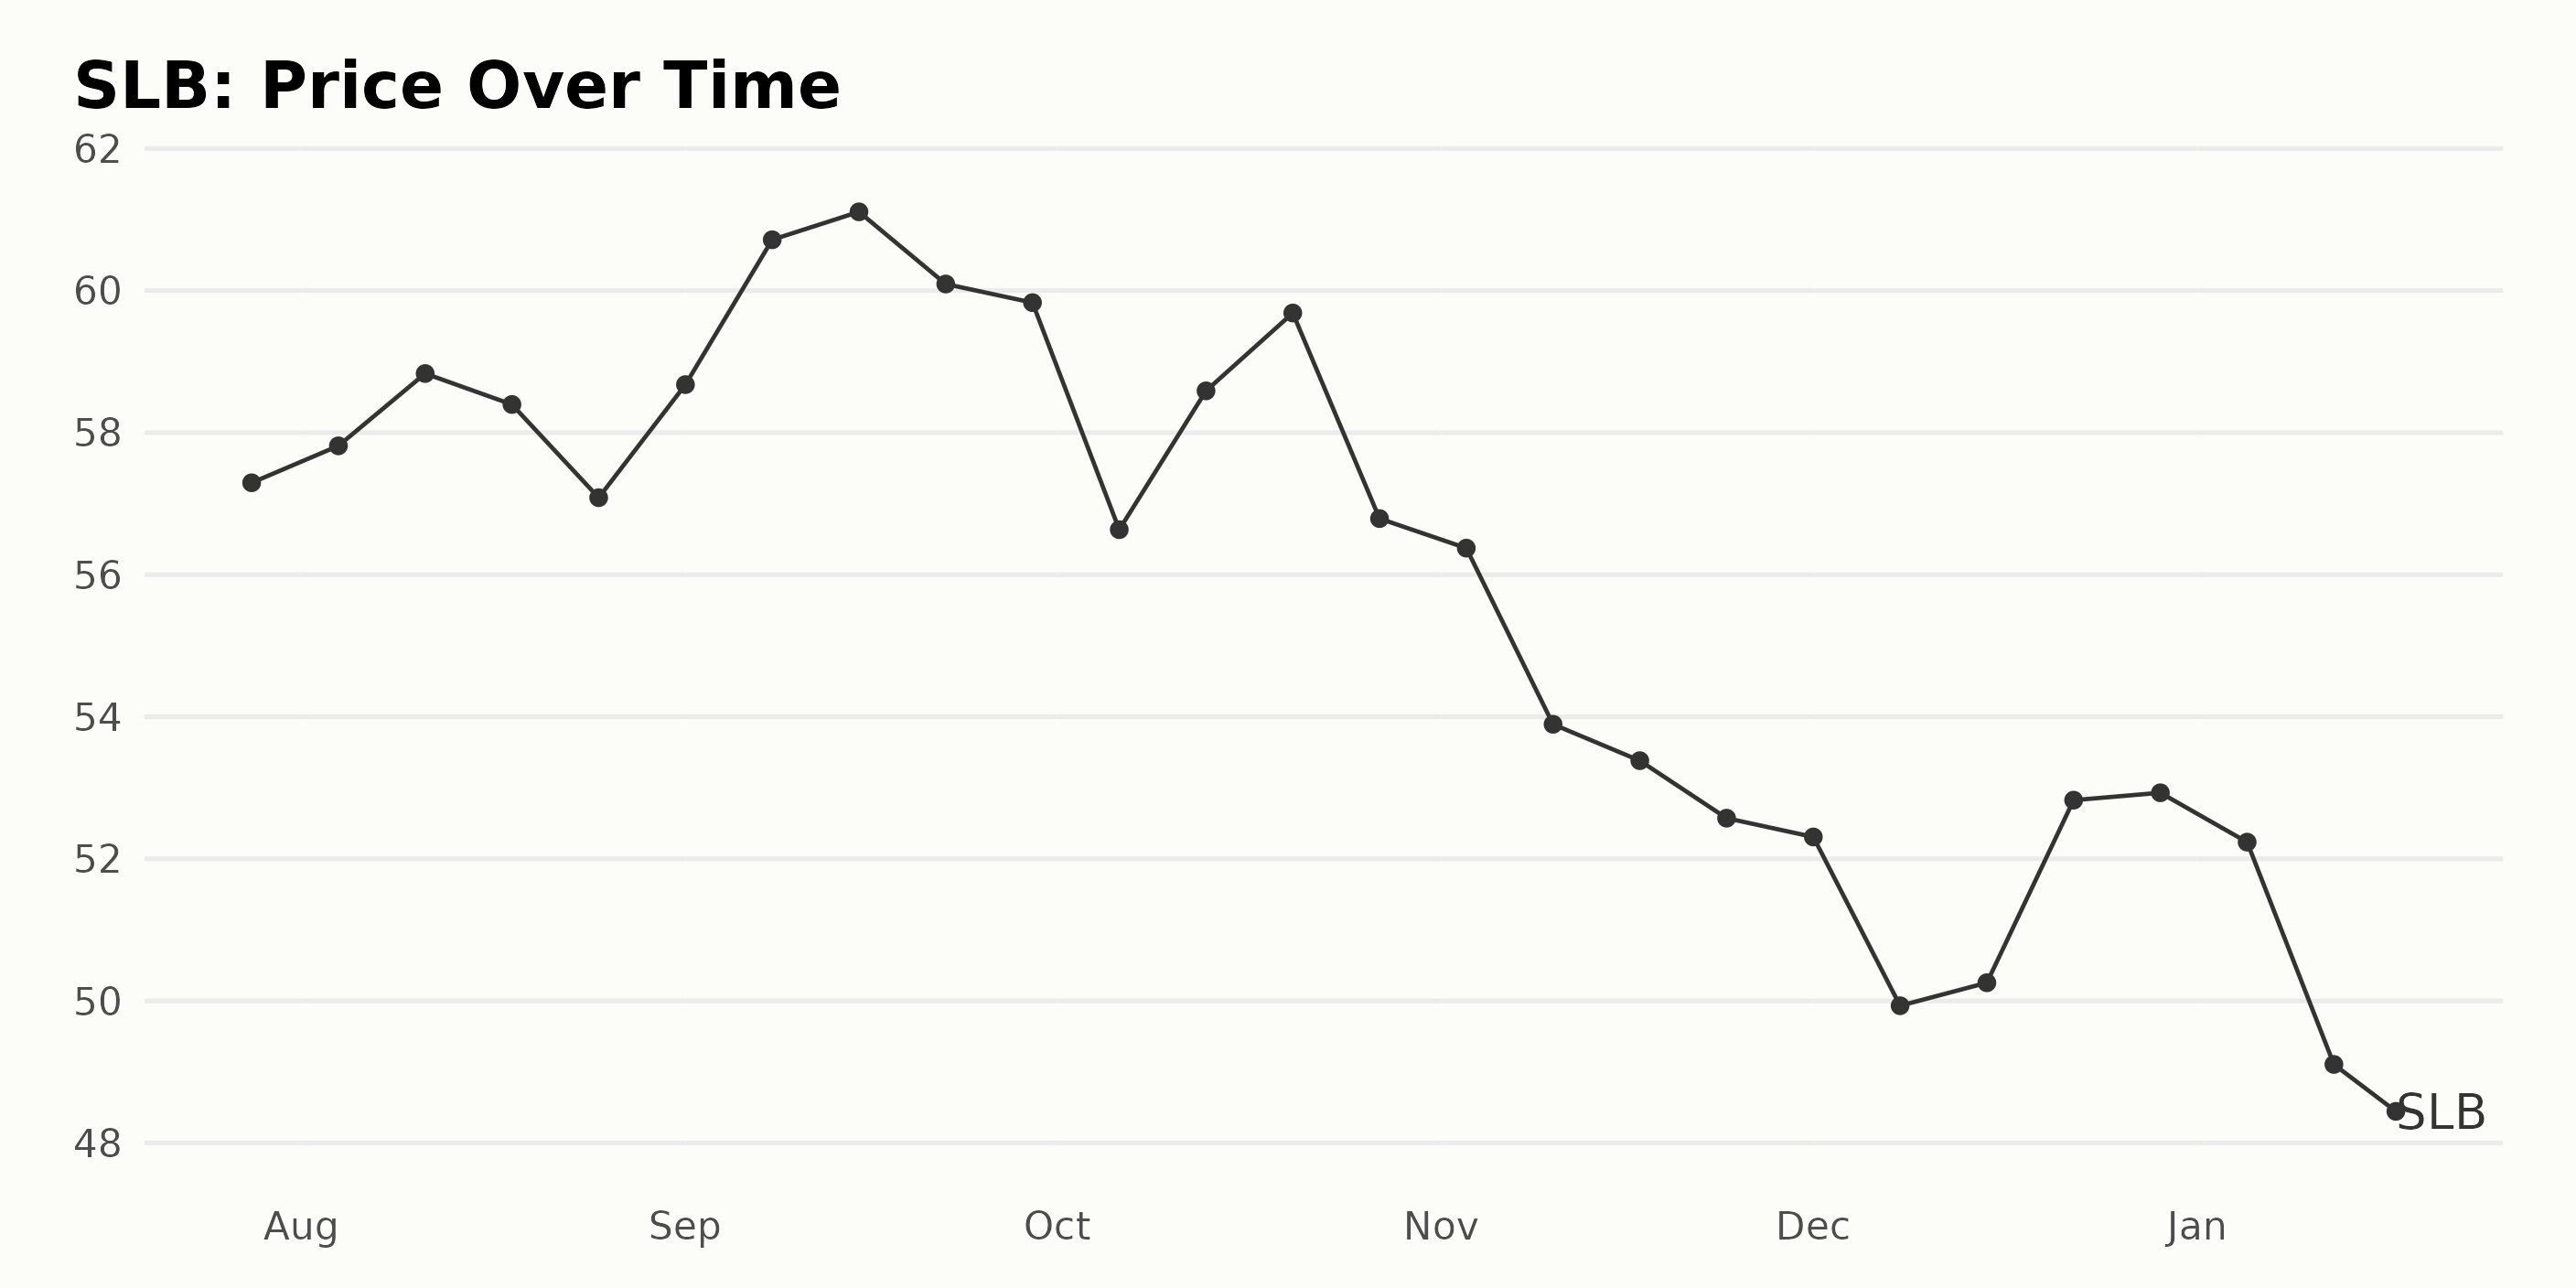
The share prices of SLB from July 28, 2023 to January 17, 2024 showcase a zig-zag pattern with fluctuating growth and decline rates.
- As of July 28, 2023, the share price was $57.29.
- It saw a slight growth to reach $58.83 by August 11, 2023.
- There was a minor dip after this, with the value falling to $57.08 by August 25, 2023.
- The most substantial rise occurred between August 25 and September 15, 2023 where the value jumped from $57.08 to $61.11.
- After a series of minor fluctuation, the shares took a downturn and fell to $56.63 on October 6, 2023.
- Mid October saw a minor rise followed by another fall in price at the end of October.
- The lowest point in this share price trend was $48.45 on January 17, 2024.
While there was growth observed in the initial few months (July - September 2023), the overall trend from July 2023 to January 2024 showcases a descending trend with an accelerating rate of decline from September 2023 to January 2024. The share price dropped from $61.11 on September 15, 2023, to $48.45 on January 17, 2024, which indicates a significant decline. Here is a chart of SLB's price over the past 180 days.
Analyzing Momentum, Growth, and Quality of Schlumberger N.V.'s POWR Ratings (2023-2024)
SLB has an overall C rating, translating to a Neutral in our POWR Ratings system. It is ranked #27 out of the 52 stocks in the Energy - Services category.
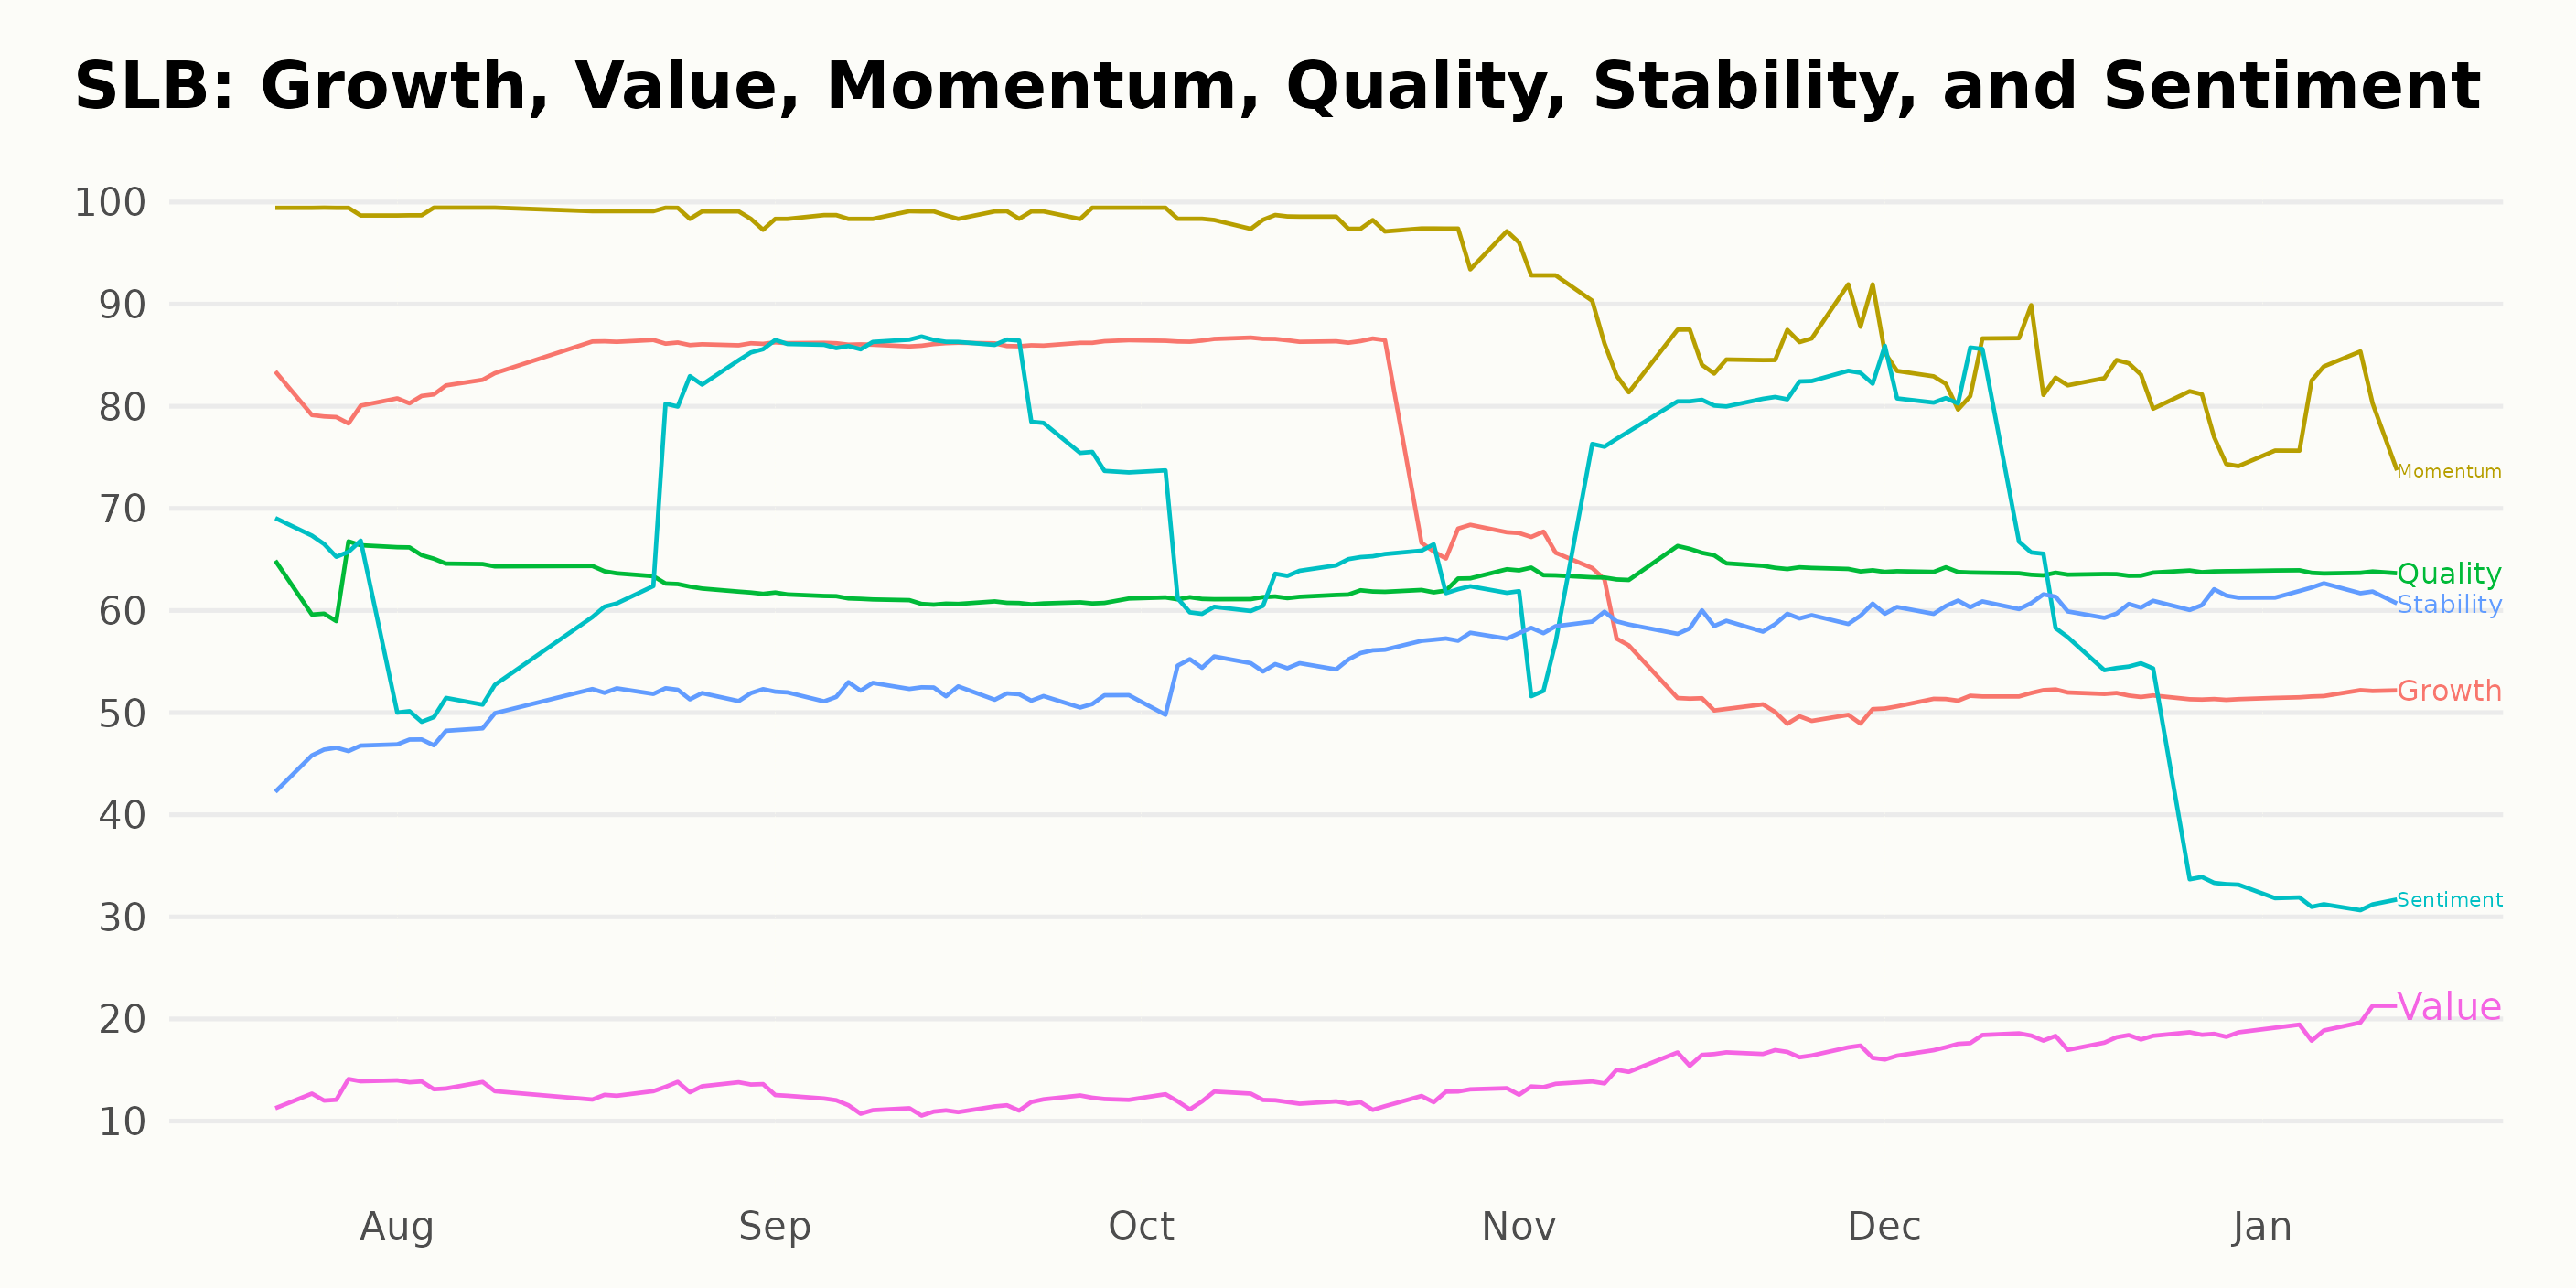
The available data allows us to examine the POWR ratings for SLB between July 2023 and January 2024. During this period, three dimensions consistently stood out as having the highest value ratings. Here's a detailed analysis for Momentum, Growth, and Quality:
Momentum: - Schlumberger continually demonstrated a strong momentum score throughout the reported period. The rating hit the most substantial mark of 99 in July, August, and September 2023. - However, there was a noticeable decline in the trend starting from October 2023 when the score started decreasing month by month, dropping to 80 by January 2024.
Growth: - The growth dimension showed an increasing trend from July to September 2023, beginning at a rating of 80 and peaking at 86 in September 2023. - The following months saw a significant decrease; in November 2023, the score dropped to 55 and hovered around the low 50s through to January 2024.
Quality: - The quality ratings for Schlumberger remained relatively consistent, maintaining a range between 61 and 64 throughout the examined months. Notably, November 2023 saw the highest scoring period with a rating of 64, which remained steady into January 2024. There were no clear increasing or decreasing trends in this dimension.
In conclusion, the Momentum and Growth dimensions demonstrate clear trends throughout this time frame, with both showing an initial high position followed by a decrease. The Quality dimension stays consistently in the mid-60s, demonstrating reliability over time for Schlumberger.
How does Schlumberger Limited (SLB) Stack Up Against its Peers?
Other stocks in the Energy - Services sector that may be worth considering are Vibra Energia S/A (PETRY), Trican Well Service Ltd. (TOLWF), and Geospace Technologies Corporation (GEOS) -- they have better POWR Ratings.
What To Do Next?
Get your hands on this special report with 3 low priced companies with tremendous upside potential even in today’s volatile markets:
3 Stocks to DOUBLE This Year >
SLB shares were trading at $48.45 per share on Thursday afternoon, up $0.56 (+1.17%). Year-to-date, SLB has declined -6.90%, versus a -0.16% rise in the benchmark S&P 500 index during the same period.
About the Author: Subhasree Kar

Subhasree’s keen interest in financial instruments led her to pursue a career as an investment analyst. After earning a Master’s degree in Economics, she gained knowledge of equity research and portfolio management at Finlatics.
The post Schlumberger (SLB): Buy or Sell Considerations Ahead of Quarterly Report appeared first on StockNews.com