We have to have a positive day to break the downtrend . Do you see that "W" that's forming for the month – broken W's are bad – you can see a broken W in February, that foretold of more selling to come. Broken W's mean that the prior bounce (the middle of the "W") was strong resistance and, after having some more time to think about it – still no one considers it a good price . That's all charts are, they are tracks that tell you where investors have been – not where they are going. What I'm telling you is how TA people interpret the charts and that does tell us where they are going and TA people, unfortunately, rule the market so I guess charts can tell us where things are going – but not for the reasons TA people think. If I'm in church, for example, and I notice that the word "Amen" causes the congregation to all say "Amen" after the Preacher, then I can draw the conclusion that reading the word "Amen" makes humans shout it out. In real-world testing that theory would fall apart but, in the church, my logic would seem rock-solid and I would think I am a very clever behaviorist. That's because I stumbled upon a specific cause and effect relationship, drew an inaccurate conclusion based on very little evidence and stuck to it because it seemed to be working – even though I was pretty much wrong about the whole thing. Welcome to Technical Analysis! Can I get an Amen ? We'd better pray the S&P can get back over our weak bounce line (4,160) next week. Notice we have a rising MACD and, if we waste that, we will be WISHING that 3,840 is support. We didn't want to take the chance with our Member Portfolios so we enhanced our hedges in the Short-Term Portfolio (STP) on a day the Long-TermPortfolio (LTP) gained $200,000. Yes, you can have it both ways if you pay attention to our 5% Rule™! IN PROGRESS
 We have to have a positive day to break the downtrend.
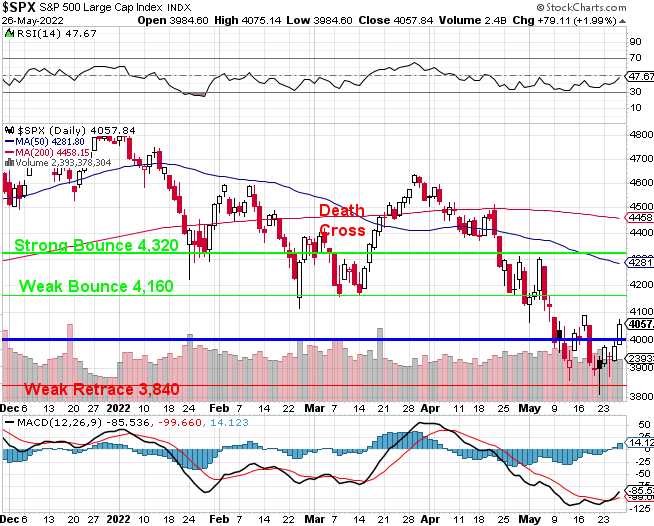
Do you see that "W" that's forming for the month – broken W's are bad – you can see a broken W in February, that foretold of more selling to come. Broken W's mean that the prior bounce (the middle of the "W") was strong resistance and, after having some more time to think about it – still no one considers it a good price.
That's all charts are, they are tracks that tell you where investors have been – not where they are going. What I'm telling you is how TA people interpret the charts and that does tell us where they are going and TA people, unfortunately, rule the market so I guess charts can tell us where things are going – but not for the reasons TA people think.
If I'm in church, for example, and I notice that the word "Amen" causes the congregation to all say "Amen" after the Preacher, then I can draw the conclusion that reading the word "Amen" makes humans shout it out. In real-world testing that theory would fall apart but, in the church, my logic would seem rock-solid and I would think I am a very clever behaviorist. That's because I stumbled upon a specific cause and effect relationship, drew an inaccurate conclusion based on very little evidence and stuck to it because it seemed to be working – even though I was pretty much wrong about the whole thing. Welcome to Technical Analysis!
Can I get an Amen?
We'd better pray the S&P can get back over our weak bounce line (4,160) next week. Notice we have a rising MACD and, if we waste that, we will be WISHING that 3,840 is support. We didn't want to take the chance with our Member Portfolios so we enhanced our hedges in the Short-Term Portfolio (STP) on a day the Long-TermPortfolio (LTP) gained $200,000. Yes, you can have it both ways if you pay attention to our 5% Rule™!
IN PROGRESS
