CURO Group Holdings Corp. (NYSE: CURO) (“CURO” or the “Company”), a market leader in providing short-term credit to underbanked consumers, today announced its financial results for the fourth quarter and full year 2017 and issued its outlook for 2018.
This press release features multimedia. View the full release here: http://www.businesswire.com/news/home/20180201006717/en/
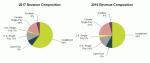
The charts present revenue contribution, including CSO fees, of the products and services that we currently offer (Graphic: Business Wire)
“We are pleased to report record results and accelerating revenue growth in our first quarter as a public company,” said Don Gayhardt, President and Chief Executive Officer. “Our strong fourth quarter caps the most successful year in our history and was fueled by excellent loan growth in all three countries and gross margin expansion. Our U.S. business grew revenue 26%, Canada outperformed our expectations and the U.K. turned EBITDA positive.”
Consolidated Summary Results | ||||||||||||||||||||||||||||
| For the Three Months Ended | For the Year Ended | |||||||||||||||||||||||||||
| (in thousands, except per share data) | 12/31/2017 | 12/31/2016 | Variance | 12/31/2017 | 12/31/2016 | Variance | ||||||||||||||||||||||
| Revenue | $ | 266,990 | $ | 218,904 | 22.0 | % | $ | 963,633 | $ | 828,596 | 16.3 | % | ||||||||||||||||
| Gross Margin | 92,164 | 63,197 | 45.8 | % | 349,237 | 293,256 | 19.1 | % | ||||||||||||||||||||
| Gross Loans Receivable | 432,837 | 286,196 | 51.2 | % | 432,837 | 286,196 | 51.2 | % | ||||||||||||||||||||
| Net Income | 6,410 | 9,585 | (33.1 | )% | 49,153 | 65,444 | (24.9 | )% | ||||||||||||||||||||
| Adjusted Net Income (1) | 19,706 | 10,723 | 83.8 | % | 79,074 | 66,411 | 19.1 | % | ||||||||||||||||||||
| Diluted Earnings per Share | $ | 0.16 | $ | 0.25 | (36.0 | )% | $ | 1.25 | $ | 1.69 | (26.0 | )% | ||||||||||||||||
| Adjusted Diluted Earnings per Share (1) | $ | 0.48 | $ | 0.27 | 77.8 | % | $ | 2.01 | $ | 1.71 | 17.5 | % | ||||||||||||||||
| EBITDA (1) | 45,705 | 37,937 | 20.5 | % | 193,250 | 191,260 | 1.0 | % | ||||||||||||||||||||
| Adjusted EBITDA (1) | 58,958 | 39,101 | 50.8 | % | 232,215 | 189,361 | 22.6 | % | ||||||||||||||||||||
| Weighted Average Shares - diluted | 40,524 | 38,902 | 39,277 | 38,803 | ||||||||||||||||||||||||
| (1) Non-GAAP Metric; see Results of Operations section for reconciliation to nearest GAAP metric | ||||||||||||||||||||||||||||
Fourth quarter 2017 highlights include:
- Total revenue of $267.0 million, up 22.0% year over year
- Revenue growth in the U.S. and U.K. of 25.7% and 32.5%, respectively; Canada growth of 7.1% as volume and earning asset growth overcame regulatory changes
- Gross margin of $92.2 million and 34.5% of revenue, up from $63.2 million and 28.9% in prior year
- GAAP Net Income of $6.4 million affected by (i) costs associated with completion of the Company's initial public offering and debt ($3.1 million), (ii) stock-based compensation costs ($8.7 million), (iii) impacts of the Tax Cuts and Jobs Act of 2017 ("2017 Tax Act") ($4.6 million) and (iv) legal settlement accruals ($2.0 million)
- Adjusted Net Income of $19.7 million compared to $10.7 million in prior year
- GAAP Diluted Earnings per Share of $0.16
- Adjusted Diluted Earnings per Share of $0.48 compared to $0.27 in fourth quarter of prior year
- Adjusted EBITDA of $59.0 million, a 50.8% increase year over year
- Closed initial public offering of 6,666,667 shares of common stock at a price of $14.00 per share; underwriters subsequently exercised option for an additional 1,000,000 shares at the original offer price on January 5, 2018
- Completed issuance of $135.0 million aggregate principal amount of additional 12.00% Senior Secured Notes due 2022 by CURO Financial Technologies Corp., a wholly-owned subsidiary
Full year 2017 highlights include:
- Total revenue of $963.6 million, up 16.3% year over year
- Revenue growth in the U.S. and U.K. of 21.6% and 17.1% respectively; Canada revenue decline of 0.9% due to regulatory changes
- Gross margin of $349.2 million and 36.2% of revenue, up from $293.3 million and 35.4% in prior year
- Gross Loans receivable grew 51.2% year over year to $432.8 million
- Installment loans grew $132.1 million or 56.9% year over year; increased from 65.5% to 71.2% of total earning assets
- GAAP Net Income of $49.2 million affected by (i) fourth quarter items above, (ii) U.K. store closure costs ($7.4 million), (iii) prior legal settlement costs ($2.3 million) and (iv) debt extinguishment costs ($12.5 million)
- Adjusted Net Income of $79.1 million compared to $66.4 million in prior year
- GAAP Diluted Earnings per Share of $1.25
- Adjusted Diluted Earnings per Share of $2.01 compared to $1.71 in fourth quarter of prior year
- Adjusted EBITDA of $232.2 million, a 22.6% increase year over year
- In addition to the aforementioned fourth quarter issuance of additional 12.00% Senior Secured Notes, refinanced and extended to 2022 the maturities of $665.0 million of debt using corporate cash and the issuance of $470.0 million of 12% Senior Secured Notes during first quarter 2017
Fiscal 2018 Outlook
The Company is initiating its fiscal full-year 2018 adjusted earnings guidance, a non-GAAP measure that excludes anticipated debt extinguishment costs as we utilize proceeds from the initial public offering to retire a portion of the 12.00% Senior Secured Notes due 2022 and stock-based compensation, as follows:
- Revenue in the range of $1.025 billion to $1.080 billion
- Net Income in the range of $110 million to $116 million
- Adjusted EBITDA in the range of $245 million to $255 million
- Estimated tax rate of 25% to 27% for the full year
- Adjusted Diluted Earnings per Share of $2.25 to $2.40
Consolidated Revenue Summary
Fourth Quarter 2017
The following table summarizes revenue by product, including CSO fees, for the periods indicated:
| For the Three Months Ended | |||||||||||||||||||||||||||||||||||||||
| December 31, 2017 | December 31, 2016 | ||||||||||||||||||||||||||||||||||||||
| (in thousands) | U.S. | Canada | U.K. | Total | U.S. | Canada | U.K. | Total | |||||||||||||||||||||||||||||||
| Unsecured Installment | $ | 123,861 | $ | 5,769 | $ | 7,248 | $ | 136,878 | $ | 89,102 | $ | 815 | $ | 4,397 | $ | 94,314 | |||||||||||||||||||||||
| Secured Installment | 27,732 | — | — | 27,732 | 21,107 | — | — | 21,107 | |||||||||||||||||||||||||||||||
| Open-End | 20,966 | 188 | — | 21,154 | 17,083 | — | — | 17,083 | |||||||||||||||||||||||||||||||
| Single-Pay | 28,592 | 38,941 | 3,335 | 70,868 | 31,309 | 42,917 | 3,407 | 77,633 | |||||||||||||||||||||||||||||||
| Ancillary | 4,666 | 5,692 | — | 10,358 | 5,091 | 3,493 | 183 | 8,767 | |||||||||||||||||||||||||||||||
| Total revenue | $ | 205,817 | $ | 50,590 | $ | 10,583 | $ | 266,990 | $ | 163,692 | $ | 47,225 | $ | 7,987 | $ | 218,904 | |||||||||||||||||||||||
During the three months ended December 31, 2017, total lending revenue (excluding revenues from ancillary products) grew $46.5 million, or 22.1%, to $256.6 million, compared to the prior year period, predominantly driven by growth in Installment loan revenue in all three countries. Unsecured Installment loan revenues rose 45.1% and Secured Installment revenues rose 31.4% on related origination volume and loan growth. Single-Pay revenues were affected primarily by regulatory changes in Canada (rate changes in Ontario and British Columbia and product changes in Alberta). U.S. and U.K. Single-Pay revenues also decreased 8.7% and 2.1%, respectively, because of continued mix shift from Single-Pay to Installment and Open-End products. Ancillary revenues increased 18.1% versus the same quarter a year ago primarily due to insurance revenue in Canada, partially offset by a decline in check cashing fees.
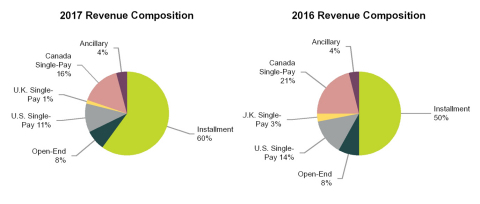
Full Year 2017
The following table summarizes revenue by product, including CSO fees, for the periods indicated.
| For the Year Ended | |||||||||||||||||||||||||||||||||||||||
| December 31, 2017 | December 31, 2016 | ||||||||||||||||||||||||||||||||||||||
| (in thousands) | U.S. | Canada | U.K. | Total | U.S. | Canada | U.K. | Total | |||||||||||||||||||||||||||||||
| Unsecured Installment | $ | 435,745 | $ | 19,013 | $ | 25,485 | $ | 480,243 | $ | 318,460 | $ | 1,143 | $ | 11,110 | $ | 330,713 | |||||||||||||||||||||||
| Secured Installment | 100,981 | — | — | 100,981 | 81,453 | — | — | 81,453 | |||||||||||||||||||||||||||||||
| Open-End | 73,308 | 188 | — | 73,496 | 66,945 | — | 3 | 66,948 | |||||||||||||||||||||||||||||||
| Single-Pay | 107,553 | 147,617 | 13,624 | 268,794 | 117,609 | 173,779 | 21,888 | 313,276 | |||||||||||||||||||||||||||||||
| Ancillary | 20,142 | 19,591 | 386 | 40,119 | 22,332 | 13,155 | 719 | 36,206 | |||||||||||||||||||||||||||||||
| Total revenue | $ | 737,729 | $ | 186,409 | $ | 39,495 | $ | 963,633 | $ | 606,799 | $ | 188,077 | $ | 33,720 | $ | 828,596 | |||||||||||||||||||||||
For full year 2017, total lending revenue (excluding revenues from ancillary products) grew $131.1 million, or 16.5%, to $923.5 million, compared to the prior year period. Growth was driven predominantly by Unsecured and Secured Installment loan revenue. Unsecured Installment loan revenues rose 45.2% on related origination increase of 46.4%. Secured Installment revenues increased 24.0%, on related origination increase of 33.2%. Single-Pay revenues were affected primarily by regulatory changes in Canada (rate changes in Ontario and British Columbia and product changes in Alberta). U.S. and U.K. Single-Pay revenues also decreased 8.6% and 37.8%, respectively, because of continued mix shift from Single-Pay to Installment and Open-End products. Ancillary revenues increased 10.8% versus the same period a year ago primarily due to insurance revenue in Canada, partially offset by a decrease in check cashing fees.
For the years ended December 31, 2017 and 2016, revenue generated through the online channel was 38% and 33%, respectively, of consolidated revenue.
Loan Volume and Portfolio Performance Analysis
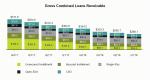
The following table summarizes Company-owned gross loans receivable, a GAAP balance sheet measure, and reconciles it to gross combined loans receivable, a non-GAAP measure including loans originated by third-party lenders through CSO programs, which are not included in the consolidated financial statements but from which we earn revenue and for which we provide a guarantee to the lender:
| Three Months Ended | |||||||||||||||||||||||||||||||||||||||
| (in millions) |
December 31, |
September 30, |
June 30, |
March 31, |
December 31, |
September 30, |
June 30, |
March 31, | |||||||||||||||||||||||||||||||
| Company-owned gross loans receivable | $ | 432.8 | $ | 393.4 | $ | 350.3 | $ | 304.8 | $ | 286.2 | $ | 244.6 | $ | 233.1 | $ | 220.7 | |||||||||||||||||||||||
| Gross loans receivable guaranteed by the Company | 78.8 | 71.2 | 62.1 | 57.8 | 68.0 | 58.7 | 52.6 | 45.4 | |||||||||||||||||||||||||||||||
| Gross combined loans receivable | $ | 511.6 | $ | 464.6 | $ | 412.4 | $ | 362.6 | $ | 354.2 | $ | 303.3 | $ | 285.7 | $ | 266.1 | |||||||||||||||||||||||
Gross combined loans receivable were $511.6 million and $354.2 million at December 31, 2017 and 2016, respectively. The increase was a result of Installment loan growth from higher originations and the Q1 Loss Recognition Change that is further detailed in the Prospectus filed with the S.E.C. pursuant to Rule 424(b)(4) on December 8, 2017. For 2017, Installment loans that are up to 90 days past due are included in gross combined loans receivable. Excluding the year-over-year effect of such past-due loans, gross combined loans receivable increased $83.4 million or 23.5% from December 31, 2016 to December 31, 2017.
Unsecured Installment Loans
Unsecured Installment revenue and gross combined loans receivable increased from the prior year quarter due to growth in the United States, primarily in Texas and California; growth in Canada, primarily in Alberta; and growth in the United Kingdom. Gross combined Unsecured Installment Loan balances (excluding past due loans) grew $49.6 million, or 30.1%, compared to December 31, 2016.
Loss provision rates as a percentage of originations (or loss provision rates) for Company Owned loans increased sequentially from 21.1% to 22.1%, reflecting normal seasonal trends and allowance coverage evaluation. Fourth quarter 2017 provision rate was consistent with the prior year provision rate of 22.0%. The effect of the Q1 Loss Recognition Change, which caused higher provision rates in 2017 was offset by improved underwriting and credit scoring, and seasoning.
Loss provision rates for loans Guaranteed by the Company decreased sequentially from 43.3% to 40.0%. This is primarily due to the impact of Hurricane Harvey relief during the third quarter of 2017 on Texas operations. Fourth quarter 2017 provision rates increased compared to the prior year quarter of 31.1%, primarily due to the Q1 Loss Recognition Change, which caused higher provision rates in 2017, as well as loan performance.
Unsecured Installment Allowance for loan losses as a percentage of Unsecured Installment gross loans receivable and Unsecured Installment CSO guarantee liability as a percentage of Unsecured Installment gross loans Guaranteed by the Company both declined from the end of the third quarter of 2017. This was a result of realization of the impacts of Hurricane Harvey, seasonal patterns in net charge-offs and evaluation of year-end allowance coverage based on underlying vintage performance. Past-due Unsecured Installment gross loans receivable and Past-due Unsecured Installment gross loans Guaranteed by the Company remained consistent quarter over quarter.
| 2017 | 2016 | |||||||||||||||||||||
(dollars in thousands, except average loan amount, unaudited) | Fourth Quarter | Third Quarter | Second Quarter | First Quarter | Fourth Quarter | |||||||||||||||||
| Unsecured Installment loans: | ||||||||||||||||||||||
| Revenue - Company Owned | $ | 67,800 | $ | 61,653 | $ | 52,550 | $ | 51,206 | $ | 39,080 | ||||||||||||
| Provision for losses - Company Owned | 29,917 | 29,079 | 17,845 | 19,309 | 24,557 | |||||||||||||||||
| Net revenue - Company Owned | $ | 37,883 | $ | 32,574 | $ | 34,705 | $ | 31,897 | $ | 14,523 | ||||||||||||
| Net charge-offs - Company Owned | $ | 32,894 | $ | 23,858 | $ | 18,858 | $ | (4,918 | ) | $ | 18,836 | |||||||||||
| Revenue - Guaranteed by the Company | $ | 69,078 | $ | 67,132 | $ | 52,599 | $ | 58,225 | $ | 55,234 | ||||||||||||
| Provision for losses - Guaranteed by the Company | 32,915 | 36,212 | 23,575 | 19,940 | 22,364 | |||||||||||||||||
| Net revenue - Guaranteed by the Company | $ | 36,163 | $ | 30,920 | $ | 29,024 | $ | 38,285 | $ | 32,870 | ||||||||||||
| Net charge-offs - Guaranteed by the Company | $ | 31,898 | $ | 34,904 | $ | 27,309 | $ | 17,088 | $ | 21,144 | ||||||||||||
| Unsecured Installment gross combined loans receivable: | ||||||||||||||||||||||
| Company owned | $ | 196,306 | $ | 181,831 | $ | 156,075 | $ | 131,386 | $ | 102,090 | ||||||||||||
| Guaranteed by the Company (1) (2) | 75,156 | 67,438 | 58,289 | 53,978 | 62,360 | |||||||||||||||||
Unsecured Installment gross combined loans receivable (1) (2) | $ | 271,462 | $ | 249,269 | $ | 214,364 | $ | 185,364 | $ | 164,450 | ||||||||||||
| Unsecured Installment Allowance for loan losses (3) | $ | 43,755 | $ | 46,938 | $ | 41,406 | $ | 42,040 | $ | 17,775 | ||||||||||||
| Unsecured Installment CSO guarantee liability (3) | $ | 17,072 | $ | 16,056 | $ | 14,748 | $ | 18,482 | $ | 15,630 | ||||||||||||
| Unsecured Installment Allowance for loan losses as a percentage of Unsecured Installment gross loans receivable | 22.3 | % | 25.8 | % | 26.5 | % | 32.0 | % | 17.4 | % | ||||||||||||
| Unsecured Installment CSO guarantee liability as a percentage of Unsecured Installment gross loans guaranteed by the Company | 22.7 | % | 23.8 | % | 25.3 | % | 34.2 | % | 25.1 | % | ||||||||||||
| Unsecured Installment past-due balances: | ||||||||||||||||||||||
| Unsecured Installment gross loans receivable (4) | $ | 44,963 | $ | 41,353 | $ | 33,534 | $ | 28,913 | — | |||||||||||||
| Unsecured Installment gross loans guaranteed by the Company (4) | $ | 12,480 | $ | 10,462 | $ | 8,204 | $ | 11,196 | — | |||||||||||||
| Past-due Unsecured Installment gross loans receivable -- percentage (2) (4) | 22.9 | % | 22.7 | % | 21.5 | % | 22.0 | % | — | |||||||||||||
| Past-due Unsecured Installment gross loans guaranteed by the Company -- percentage (2) (4) | 16.6 | % | 15.5 | % | 14.1 | % | 20.7 | % | — | |||||||||||||
| Unsecured Installment other information: | ||||||||||||||||||||||
| Originations - Company owned (5) | $ | 135,284 | $ | 137,618 | $ | 119,636 | $ | 98,691 | $ | 111,412 | ||||||||||||
| Average loan amount - Company owned | $ | 714 | $ | 730 | $ | 697 | $ | 687 | $ | 646 | ||||||||||||
| Originations - Guaranteed by the Company (1) (5) | $ | 82,326 | $ | 83,680 | $ | 68,338 | $ | 55,112 | $ | 71,858 | ||||||||||||
| Average loan amount - Guaranteed by the Company | $ | 526 | $ | 526 | $ | 485 | $ | 482 | $ | 478 | ||||||||||||
| Unsecured Installment ratios: | ||||||||||||||||||||||
| Provision as a percentage of originations - Company Owned | 22.1 | % | 21.1 | % | 14.9 | % | 19.6 | % | 22.0 | % | ||||||||||||
| Provision as a percentage of gross loans receivable - Company Owned | 15.2 | % | 16.0 | % | 11.4 | % | 14.7 | % | 24.1 | % | ||||||||||||
| Provision as a percentage of originations - Guaranteed by the Company | 40.0 | % | 43.3 | % | 34.5 | % | 36.2 | % | 31.1 | % | ||||||||||||
| Provision as a percentage of gross loans receivable - Guaranteed by the Company | 43.8 | % | 53.7 | % | 40.4 | % | 36.9 | % | 35.9 | % | ||||||||||||
(1) | Includes loans originated by third-party lenders through CSO programs, which are not included in the consolidated financial statements. | |
(2) | Non-GAAP measure. | |
(3) | Allowance for loan losses is reported as a contra-asset reducing gross loans receivable while the CSO guarantee liability is reported as a liability on the Consolidated Balance Sheets. | |
(4) | As part of the Q1 Loan Loss Recognition Change past-due receivables remain on the balance sheet until charged off. In all prior periods loans were written-off when a customer missed a scheduled payment. | |
(5) | We have revised previously-reported origination statistics to conform to current year methodology. | |
Secured Installment Loans
Secured Installment loan revenue and gross combined loans receivable increased from the prior year quarter due primarily to growth in California and Arizona. Gross combined Secured Installment loan balances (excluding past due loans) increased by $8.5 million, or 12.6%, compared to December 31, 2016, on higher origination volumes. Secured Installment Allowance for loan losses as a percentage of Secured Installment gross loans receivable settled at a more normalized range in the fourth quarter and improved slightly over the same quarter a year ago on underlying vintage performance. The Past-due Secured Installment gross loans receivable rate was consistent sequentially with third quarter.
| 2017 | 2016 | |||||||||||||||||||||
| (dollars in thousands, except average loan amount, unaudited) | Fourth Quarter | Third Quarter | Second Quarter | First Quarter | Fourth Quarter | |||||||||||||||||
| Secured Installment loans: | ||||||||||||||||||||||
| Revenue | $ | 27,732 | $ | 26,407 | $ | 23,173 | $ | 23,669 | $ | 21,107 | ||||||||||||
| Provision for losses | 10,051 | 6,512 | 4,955 | 7,436 | 7,159 | |||||||||||||||||
| Net revenue | $ | 17,681 | $ | 19,895 | $ | 18,218 | $ | 16,233 | $ | 13,948 | ||||||||||||
| Net charge-offs | $ | 10,802 | $ | 11,597 | $ | 6,481 | $ | (2,235 | ) | $ | 6,588 | |||||||||||
| Secured Installment gross combined loan balances: | ||||||||||||||||||||||
| Secured Installment gross combined loans receivable (1)(2) | $ | 92,817 | $ | 88,730 | $ | 80,077 | $ | 71,213 | $ | 67,738 | ||||||||||||
| Secured Installment Allowance for loan losses and CSO guarantee liability (3) | $ | 14,194 | $ | 14,945 | $ | 20,030 | $ | 21,557 | $ | 11,885 | ||||||||||||
| Secured Installment Allowance for loan losses and CSO guarantee liability as a percentage of Secured Installment gross combined loans receivable | 15.3 | % | 16.8 | % | 25.0 | % | 30.3 | % | 17.5 | % | ||||||||||||
| Secured Installment past-due balances: | ||||||||||||||||||||||
| Secured Installment past-due gross loans receivable and gross loans guaranteed by the Company(4) | $ | 16,554 | $ | 15,265 | $ | 12,630 | $ | 10,186 | $ | — | ||||||||||||
| Past-due Secured Installment gross loans receivable and gross loans guaranteed by the Company -- percentage (2)(4) | 17.8 | % | 17.2 | % | 15.8 | % | 14.3 | % | — | % | ||||||||||||
| Secured Installment other information: | ||||||||||||||||||||||
| Originations (1)(5) | $ | 48,577 | $ | 52,526 | $ | 45,596 | $ | 37,641 | $ | 43,803 | ||||||||||||
| Average loan amount (1)(5) | $ | 1,303 | $ | 1,299 | $ | 1,231 | $ | 1,326 | $ | 1,197 | ||||||||||||
| Secured Installment ratios: | ||||||||||||||||||||||
| Provision as a percentage of originations | 20.7 | % | 12.4 | % | 10.9 | % | 19.8 | % | 16.3 | % | ||||||||||||
| Provision as a percentage of gross combined loans receivable | 10.8 | % | 7.3 | % | 6.2 | % | 10.4 | % | 10.6 | % | ||||||||||||
(1) | Includes loans originated by third-party lenders through CSO programs, which are not included in the consolidated financial statements. | |
(2) | Non-GAAP measure. | |
(3) | Allowance for loan losses is reported as a contra-asset reducing gross loans receivable while the CSO guarantee liability is reported as a liability on the Consolidated Balance Sheets. | |
(4) | As part of the Q1 Loan Loss Recognition Change past-due receivables remain on the balance sheet until charged off. In all prior periods loans were written-off when a customer missed a scheduled payment. | |
(5) | We have revised previously-reported origination statistics to conform to current year methodology. | |
Open-End Loans
Open-End loan balances increased by $17.5 million, or 57.4%, compared to December 31, 2016, from year-over-year growth in Kansas and Tennessee of 21.3% and 24.2%, respectively, the 2017 launch of Open-End in Virginia ($6.2 million in balances at the end of 2017) and conversion in the fourth quarter of 2017 of LendDirect Unsecured Installment loans to Open-End in Canada ($7.2 million in balances at the end of 2017). The provision for losses and Open-End Allowance for loan losses as a percentage of Open-end gross loans receivable decreased due to improved collection trends and portfolio performance for existing markets, seasoning of the Tennessee loan book and the effect on mix of converting LendDirect to Open-End - as with our experience with other products in Canada, the LendDirect Open-End portfolio is expected to perform better relative to U.S. products.
| 2017 | 2016 | |||||||||||||||||||||
| (dollars in thousands, except average loan amount, unaudited) | Fourth Quarter | Third Quarter | Second Quarter | First Quarter | Fourth Quarter | |||||||||||||||||
| Open-End loans: | ||||||||||||||||||||||
| Revenue | $ | 21,154 | $ | 18,630 | $ | 15,805 | $ | 17,907 | $ | 17,085 | ||||||||||||
| Provision for losses | 8,334 | 6,348 | 4,298 | 3,265 | 6,283 | |||||||||||||||||
| Net revenue | $ | 12,820 | $ | 12,282 | $ | 11,507 | $ | 14,642 | $ | 10,802 | ||||||||||||
| Net charge-offs | $ | 6,799 | $ | 5,991 | $ | 4,343 | $ | 3,876 | $ | 6,085 | ||||||||||||
| Open-End gross loans receivable | $ | 47,949 | $ | 32,133 | $ | 26,771 | $ | 25,626 | $ | 30,462 | ||||||||||||
| Allowance for loan losses | $ | 6,426 | $ | 4,880 | $ | 4,523 | $ | 4,572 | $ | 5,179 | ||||||||||||
| Open-End Allowance for loan losses as a percentage of Open-End gross loans receivable | 13.4 | % | 15.2 | % | 16.9 | % | 17.8 | % | 17.0 | % | ||||||||||||
| Open-End other information: | ||||||||||||||||||||||
| Originations (1) | $ | 20,313 | $ | 9,388 | $ | 6,646 | $ | 5,463 | $ | 9,880 | ||||||||||||
| Average loan amount (1) | $ | 579 | $ | 463 | $ | 451 | $ | 454 | $ | 459 | ||||||||||||
| Open-End ratios: | ||||||||||||||||||||||
| Provision as a percentage of originations | 41.0 | % | 67.6 | % | 64.7 | % | 59.8 | % | 63.6 | % | ||||||||||||
| Provision as a percentage of gross combined loans receivable | 17.4 | % | 19.8 | % | 16.1 | % | 12.7 | % | 20.6 | % | ||||||||||||
(1) | We have revised previously-reported origination statistics to conform to current year methodology. | |
Single-Pay
Single-Pay revenue, provision and combined loans receivable during the three and twelve months ended December 31, 2017 were affected primarily by regulatory changes in Canada (rate changes in Ontario and British Columbia and product shift from Single-Pay to Installment in Alberta). Single-Pay revenue in the United States also declined compared to the prior year due to the continued shift toward Installment and Open-End products. The improvement in the provision for losses in the fourth quarter of 2017 as compared to the fourth quarter of 2016 was primarily due to a lower proportion of Single-Pay loans in the U.K. where loan loss rates are higher than in the U.S. and Canada.
| 2017 | 2016 | |||||||||||||||||||||
| (dollars in thousands, unaudited) | Fourth Quarter | Third Quarter | Second Quarter | First Quarter | Fourth Quarter | |||||||||||||||||
| Single-Pay loans: | ||||||||||||||||||||||
| Revenue | $ | 70,868 | $ | 70,895 | $ | 63,241 | $ | 63,790 | $ | 77,617 | ||||||||||||
| Provision for losses | 17,952 | 20,632 | 14,289 | 11,399 | 19,655 | |||||||||||||||||
| Net revenue | $ | 52,916 | $ | 50,263 | $ | 48,952 | $ | 52,391 | $ | 57,962 | ||||||||||||
| Net charge-offs | $ | 17,362 | $ | 20,515 | $ | 13,849 | $ | 12,499 | $ | 20,468 | ||||||||||||
| Single-Pay gross combined loans receivable (1) (2) | $ | 99,400 | $ | 94,476 | $ | 91,230 | $ | 80,423 | $ | 91,579 | ||||||||||||
| Single-Pay Allowance for loan losses and CSO guarantee liability (3) | $ | 5,915 | $ | 5,342 | $ | 5,313 | $ | 4,736 | $ | 5,775 | ||||||||||||
| Single-Pay Allowance for loan losses and CSO guarantee liability as a percentage of Single-Pay gross loans receivable | 6.0 | % | 5.7 | % | 5.8 | % | 5.9 | % | 6.3 | % | ||||||||||||
(1) | Includes loans originated by third-party lenders through CSO programs, which are not included in our consolidated financial statements. | |
(2) | Non-GAAP measure. | |
(3) | Allowance for loan losses is reported as a contra-asset reducing gross loans receivable while the CSO guarantee liability is reported as a liability on the Consolidated Balance Sheets. | |
Results of Operations - CURO Group Consolidated Operations
Condensed Consolidated Statements of Income | |||||||||||||||||||||||||||||||
| (in thousands, except per share data) | Three Months Ended December 31, | Year Ended December 31, | |||||||||||||||||||||||||||||
| 2017 | 2016 | Change $ | Change % | 2017 | 2016 | Change $ | Change % | ||||||||||||||||||||||||
| Revenue | $ | 266,990 | $ | 218,904 | $ | 48,086 | 22.0 | % | $ | 963,633 | $ | 828,596 | $ | 135,037 | 16.3 | % | |||||||||||||||
| Provision for losses | 99,703 | 80,987 | 18,716 | 23.1 | % | 326,226 | 258,289 | 67,937 | 26.3 | % | |||||||||||||||||||||
| Net revenue | 167,287 | 137,917 | 29,370 | 21.3 | % | 637,407 | 570,307 | 67,100 | 11.8 | % | |||||||||||||||||||||
| Advertising costs | 16,459 | 14,996 | 1,463 | 9.8 | % | 52,058 | 43,921 | 8,137 | 18.5 | % | |||||||||||||||||||||
| Non-advertising costs of providing services | 58,664 | 59,724 | (1,060 | ) | (1.8 | )% | 236,112 | 233,130 | 2,982 | 1.3 | % | ||||||||||||||||||||
| Total cost of providing services | 75,123 | 74,720 | 403 | 0.5 | % | 288,170 | 277,051 | 11,119 | 4.0 | % | |||||||||||||||||||||
| Gross margin | 92,164 | 63,197 | 28,967 | 45.8 | % | 349,237 | 293,256 | 55,981 | 19.1 | % | |||||||||||||||||||||
| Operating (income) expense | |||||||||||||||||||||||||||||||
| Corporate, district and other | 51,176 | 29,270 | 21,906 | 74.8 | % | 154,973 | 124,274 | 30,699 | 24.7 | % | |||||||||||||||||||||
| Interest expense | 21,990 | 16,155 | 5,835 | 36.1 | % | 82,684 | 64,334 | 18,350 | 28.5 | % | |||||||||||||||||||||
| Loss (gain) on extinguishment of debt | — | 0 | 0 | # | 12,458 | (6,991 | ) | 19,449 | # | ||||||||||||||||||||||
| Restructuring costs | — | 651 | (651 | ) | # | 7,393 | 3,618 | 3,775 | # | ||||||||||||||||||||||
| Total operating expense | 73,166 | 46,076 | 27,090 | 58.8 | % | 257,508 | 185,235 | 72,273 | 39.0 | % | |||||||||||||||||||||
| Net income before income taxes | 18,998 | 17,121 | 1,877 | 11.0 | % | 91,729 | 108,021 | (16,292 | ) | (15.1 | )% | ||||||||||||||||||||
| Provision for income taxes | 12,588 | 7,536 | 5,052 | 67.0 | % | 42,576 | 42,577 | (1 | ) | 0.0 | % | ||||||||||||||||||||
| Net income | 6,410 | 9,585 | (3,175 | ) | (33.1 | )% | 49,153 | 65,444 | (16,291 | ) | (24.9 | )% | |||||||||||||||||||
| # - Variance greater than 100% or not meaningful. | |||||||||||||||||||||||||||||||
Reconciliation of Net Income and Diluted Earnings per Share to Adjusted Net Income and Adjusted Diluted Earnings per share, non-GAAP measures | ||||||||||||||||||||||||||||||||
| (in thousands, except per share data) | Three Months Ended December 31, | Year Ended December 31, | ||||||||||||||||||||||||||||||
| 2017 | 2016 | Change $ | Change % | 2017 | 2016 | Change $ | Change % | |||||||||||||||||||||||||
| Net Income | $ | 6,410 | $ | 9,585 | $ | (3,175 | ) | (33.1 | )% | $ | 49,153 | $ | 65,444 | $ | (16,291 | ) | (24.9 | )% | ||||||||||||||
| Adjustments: | ||||||||||||||||||||||||||||||||
| Loss (gain) on extinguishment of debt (1) | — | — | 12,458 | (6,991 | ) | |||||||||||||||||||||||||||
| Restructuring costs (2) | — | 651 | 7,393 | 3,618 | ||||||||||||||||||||||||||||
| Legal settlements (3) | 2,000 | — | 4,311 | — | ||||||||||||||||||||||||||||
| Transaction-related costs (4) | 3,050 | 183 | 5,573 | 329 | ||||||||||||||||||||||||||||
| Share-based cash and non-cash compensation (5) | 8,690 | 311 | 10,446 | 1,148 | ||||||||||||||||||||||||||||
| Intangible asset amortization | 695 | 784 | 2,502 | 3,492 | ||||||||||||||||||||||||||||
| Impact of tax law changes (6) | 4,635 | — | 4,635 | — | ||||||||||||||||||||||||||||
| Cumulative tax effect of adjustments | (5,774 | ) | (791 | ) | (17,397 | ) | (629 | ) | ||||||||||||||||||||||||
| Adjusted Net Income | $ | 19,706 | $ | 10,723 | $ | 8,983 | 83.8 | % | $ | 79,074 | $ | 66,411 | $ | 12,663 | 19.1 | % | ||||||||||||||||
| Net income | $ | 6,410 | $ | 9,585 | $ | 49,153 | $ | 65,444 | ||||||||||||||||||||||||
| Diluted Weighted Average Shares Outstanding | 40,524 | 38,902 | 39,277 | 38,803 | ||||||||||||||||||||||||||||
| Diluted Earnings per Share | $ | 0.16 | $ | 0.25 | $ | (0.09 | ) | (36.0 | )% | $ | 1.25 | $ | 1.69 | $ | (0.44 | ) | (26.0 | )% | ||||||||||||||
| Per Share impact of adjustments to Net Income | 0.33 | 0.02 | 0.76 | 0.02 | ||||||||||||||||||||||||||||
| Adjusted Diluted earnings per share | $ | 0.49 | $ | 0.27 | $ | 0.21 | 77.8 | % | $ | 2.01 | $ | 1.71 | $ | 0.30 | 17.5 | % | ||||||||||||||||
Reconciliation of Net Income to EBITDA and Adjusted EBITDA, non-GAAP measures | ||||||||||||||||||||||||||||||||
| Three Months Ended December 31, | Year Ended December 31, | |||||||||||||||||||||||||||||||
| 2017 | 2016 | Change $ | Change % | 2017 | 2016 | Change $ | Change % | |||||||||||||||||||||||||
| Net income | $ | 6,410 | $ | 9,585 | $ | (3,175 | ) | (33.1 | )% | $ | 49,153 | $ | 65,444 | $ | (16,291 | ) | (24.9 | )% | ||||||||||||||
| Provision for income taxes | 12,588 | 7,536 | 5,052 | 67.0 | % | 42,576 | 42,577 | (1 | ) | — | % | |||||||||||||||||||||
| Interest expense | 21,990 | 16,155 | 5,835 | 36.1 | % | 82,684 | 64,334 | 18,350 | 28.5 | % | ||||||||||||||||||||||
| Depreciation and amortization | 4,717 | 4,661 | 56 | 1.2 | % | 18,837 | 18,905 | (68 | ) | (0.4 | )% | |||||||||||||||||||||
| EBITDA | 45,705 | 37,937 | 7,768 | 20.5 | % | 193,250 | 191,260 | 1,990 | 1.0 | % | ||||||||||||||||||||||
| Loss (gain) on extinguishment of debt (1) | — | — | 12,458 | (6,991 | ) | |||||||||||||||||||||||||||
| Restructuring costs (2) | — | 651 | 7,393 | 3,618 | ||||||||||||||||||||||||||||
| Legal settlements (3) | 2,000 | — | 4,311 | — | ||||||||||||||||||||||||||||
| Transaction-related costs (4) | 3,050 | 183 | 5,573 | 329 | ||||||||||||||||||||||||||||
| Share-based cash and non-cash compensation (5) | 8,690 | 311 | 10,446 | 1,148 | ||||||||||||||||||||||||||||
| Other adjustments (7) | (487 | ) | 19 | (1,216 | ) | (3 | ) | |||||||||||||||||||||||||
| Adjusted EBITDA | $ | 58,958 | $ | 39,101 | $ | 19,857 | 50.8 | % | $ | 232,215 | $ | 189,361 | $ | 42,854 | 22.6 | % | ||||||||||||||||
| Adjusted EBITDA Margin | 22.1 | % | 17.9 | % | 24.1 | % | 22.9 | % | ||||||||||||||||||||||||
| (1) | For the year ended December 31, 2017, the $12.5 million loss from the extinguishment of debt was due to the redemption of CURO Intermediate Holding Corp.'s ("CURO Intermediate") 10.75% Senior Secured Notes due 2018 and the 12.00% Senior Cash Pay Notes due 2017. For year ended December 31, 2016, the $7.0 million gain resulted from the Company’s purchase of CURO Intermediate’s 10.75% Senior Secured Notes in September 2016. | |
| (2) | Restructuring costs of $3.6 million for the year ended December 31, 2016 represented the elimination of certain corporate positions in the Canadian headquarters and the costs incurred related to the closure of seven underperforming stores in Texas. Restructuring costs of $7.4 million for the year ended December 31, 2017 were due to the closure of the remaining 13 U.K. stores. | |
| (3) | Legal settlements of $4.3 million for the year ended December 31, 2017 includes $2.3 million for the settlement of Harrison, et al v. Principal Investments, Inc. et al., and $2.0 million for our offer to reimburse certain bank overdraft or non-sufficient funds fees because of possible borrower confusion about certain electronic payments we initiated on their loans. See related discussion in the Prospectus filed pursuant to Rule 424(b)(4) on December 8, 2017 for further information. | |
(4) | Transaction-related costs include professional fees paid in connection with potential transactions, expenses related to the Company's Initial Public Offering on December 7, 2017 and expenses related to issuance of $135.0 million of the Company's addition Senior Notes due 2022 in the fourth quarter of 2017 and the original issuance of $470.0 million of these notes in the first quarter of 2017. | |
(5) | The Company approved the adoption of a share-based compensation plan during 2010 for key members of its senior management team. The estimated fair value of share-based awards is recognized as non-cash compensation expense on a straight-line basis over the vesting period. During the second, third and fourth quarters of 2017, the underlying option holders were paid a bonus in conjunction with dividends paid during the respective quarters (“Special Bonuses”). The expense recognized during each quarter related to the payment of the Special Bonuses on vested options. All deferred and unvested Special Bonus amounts were accelerated upon the completion of the Company’s IPO in December 2017 so no further expense will be incurred in future periods relating to the Special Bonuses. | |
(6) | As a result of the 2017 Tax Act, which was signed into law on December 22, 2017, the Company revalued the deferred tax assets and deferred tax liabilities to reflect expected value at utilization, resulting in a $3.5 million net tax benefit. In addition, in accordance with this law, the Company recognized an $8.1 million tax expense related to the tax now assessed on un-repatriated earnings from the Company's operations in Canada. | |
(7) | Other adjustments include deferred rent and the intercompany foreign exchange impact. Deferred rent represents the non-cash component of rent expense. Rent expense is recognized ratably on a straight-line basis over the lease term. | |
For the three months ended December 31, 2017 and 2016
Revenue and Net Revenue
Revenue increased $48.1 million, or 22.0%, to $267.0 million for the three months ended December 31, 2017 from $218.9 million for the three months ended December 31, 2016. U.S. revenue increased 25.7% on volume growth, U.K. revenue increased by 32.5%, and revenue in Canada increased 7.1% where volume growth overcame regulatory impacts on rates and product mix.
Provision for losses increased $18.7 million, or 23.1%, to $99.7 million for the three months ended December 31, 2017 from $81.0 million for the three months ended December 31, 2016 because of related Unsecured Installment originations increase of 18.7% and Secured Installment originations increase of 10.9%. This is explained more fully in the segment analysis that follows.
Cost of Providing Services
The total cost of providing services increased $0.4 million, or 0.5%, to $75.1 million in the three months ended December 31, 2017, compared to $74.7 million in the three months ended December 31, 2016 because of higher customer acquisition spend.
Operating Expenses
Corporate, district and other expense increased $21.9 million, or 74.8% primarily due to items described previously in the "Reconciliation of Net Income and Diluted Earnings per Share to Adjusted Net Income and Adjusted Diluted Earnings per Share, non-GAAP measures" as well as increases in payroll primarily from increased headcount in technology and analytics. Interest expense is higher because of increased debt outstanding.
Provision for Income Taxes
The effective tax rate for the three months ended December 31, 2017 was 66.3% compared to 44.0% for the three months ended December 31, 2016. As a result of the 2017 Tax Act, this quarter’s effective tax rate includes a net one-time charge of $4.6 million from adjustments to deferred tax assets and liabilities and recognition of tax expense related to Canadian earnings that have not been repatriated. Excluding the impact of the 2017 Tax Act, the effective tax rate for the fourth quarter of 2017 was 41.8%.
For the year ended December 31, 2017 and 2016
Revenue and Net Revenue
Revenue increased $135.0 million, or 16.3% to $963.6 million for the year ended December 31, 2017 from $828.6 million for the prior year period. U.S. revenue increased $130.9 million on volume growth, the U.K. increased $5.8 million, and Canada declined $1.7 million because of regulatory impacts on rates and product mix.
Provision for losses increased $67.9 million, or 26.3% to $326.2 million for the year ended December 31, 2017 from $258.3 million for the prior year because of higher origination volumes and higher loan balances.
Cost of Providing Services
The total cost of providing services increased $11.1 million, or 4.0%, to $288.2 million for the year ended December 31, 2017, compared to $277.1 million for the year ended December 31, 2016, due primarily to 18.5% higher marketing spend as well as increases in occupancy, office and other operating expenses.
Operating Expenses
Corporate, district and other expenses increased $30.7 million primarily due to debt extinguishment costs, share-based cash and non-cash compensation, IPO-related costs and legal settlement costs as described above in the reconciliation of Net Income to Adjusted Net Income as well as increases in payroll, collections, office and technology-related costs.
Interest expense in the current year period increased by approximately $18.4 million which was the result of accrued interest on the retired notes through the redemption notice period, and increased debt outstanding.
Provision for Income Taxes
The effective tax rate for the year ended December 31, 2017 was 46.4% compared to 39.4% for the prior year. As a result of the 2017 Tax Act, the full year effective tax rate includes a net one-time charge of $4.6 million from adjustments to deferred tax assets and liabilities and recognition of tax expense related to Canadian earnings that have not been repatriated. Excluding the impact of the 2017 Tax Act, the effective tax rate for full-year 2017 was 41.3%.
The remaining change in the effective tax rate from the prior year was primarily due to U.K. operations. In the 2017, U.K. results include $7.4 million of restructuring costs related to the closure of the remaining 13 U.K. stores. We recorded a 100% valuation allowance against the resulting deferred tax asset and therefore did not recognize the related tax benefit.
Segment Analysis
We report financial results for three reportable segments: the United States, Canada and the United Kingdom. Following is a recap of results of operations for the segment and period indicated:
| U.S. Segment Results | Three Months Ended December 31, | Year Ended December 31, | ||||||||||||||||||||||||||||||
| Change | Change | |||||||||||||||||||||||||||||||
| (dollars in thousands) | 2017 | 2016 | $ | % | 2017 | 2016 | $ | % | ||||||||||||||||||||||||
| Revenue | $ | 205,817 | $ | 163,691 | $ | 42,126 | 25.7 | % | $ | 737,729 | $ | 606,798 | $ | 130,931 | 21.6 | % | ||||||||||||||||
| Provision for losses | 86,833 | 65,150 | 21,683 | 33.3 | % | 267,491 | 207,748 | 59,743 | 28.8 | % | ||||||||||||||||||||||
| Net revenue | 118,984 | 98,541 | 20,443 | 20.7 | % | 470,238 | 399,050 | 71,188 | 17.8 | % | ||||||||||||||||||||||
| Advertising costs | 11,552 | 11,393 | 159 | 1.4 | % | 36,148 | 30,340 | 5,808 | 19.1 | % | ||||||||||||||||||||||
| Non-advertising costs of providing services | 41,571 | 42,422 | (851 | ) | (2.0 | )% | 166,875 | 164,382 | 2,493 | 1.5 | % | |||||||||||||||||||||
| Total cost of providing services | 53,123 | 53,815 | (692 | ) | (1.3 | )% | 203,023 | 194,722 | 8,301 | 4.3 | % | |||||||||||||||||||||
| Gross margin | 65,861 | 44,726 | 21,135 | 47.3 | % | 267,215 | 204,328 | 62,887 | 30.8 | % | ||||||||||||||||||||||
| Corporate, district and other | 42,504 | 23,007 | 19,497 | 84.7 | % | 120,803 | 88,539 | 32,264 | 36.4 | % | ||||||||||||||||||||||
| Interest expense | 21,932 | 16,149 | 5,783 | 35.8 | % | 82,495 | 64,276 | 18,219 | 28.3 | % | ||||||||||||||||||||||
| Loss (gain) on extinguishment of debt | — | — | — | # | 12,458 | (6,991 | ) | 19,449 | # | |||||||||||||||||||||||
| Restructuring and other costs | — | 198 | (198 | ) | # | — | 1,726 | (1,726 | ) | # | ||||||||||||||||||||||
| Total operating expense | 64,436 | 39,354 | 25,082 | 63.7 | % | 215,756 | 147,550 | 68,206 | 46.2 | % | ||||||||||||||||||||||
| Segment operating income | 1,425 | 5,372 | (3,947 | ) | (73.5 | )% | 51,459 | 56,778 | (5,319 | ) | (9.4 | )% | ||||||||||||||||||||
| Interest expense | 21,932 | 16,149 | 5,783 | 35.8 | % | 82,495 | 64,276 | 18,219 | 28.3 | % | ||||||||||||||||||||||
| Depreciation and amortization | 3,443 | 3,395 | 48 | 1.4 | % | 13,643 | 13,196 | 447 | 3.4 | % | ||||||||||||||||||||||
| EBITDA | 26,800 | 24,916 | 1,884 | 7.6 | % | 147,597 | 134,250 | 13,347 | 9.9 | % | ||||||||||||||||||||||
| Loss (gain) on extinguishment of debt | — | — | — | 12,458 | (6,991 | ) | 19,449 | |||||||||||||||||||||||||
| Restructuring and other costs | — | 198 | (198 | ) | — | 1,726 | (1,726 | ) | ||||||||||||||||||||||||
| Legal settlement cost | 2,000 | — | 2,000 | 4,311 | — | 4,311 | ||||||||||||||||||||||||||
| Other adjustments | (63 | ) | 18 | (81 | ) | (110 | ) | 128 | (238 | ) | ||||||||||||||||||||||
| Transaction related costs | 3,050 | 183 | 2,867 | 5,573 | 329 | 5,244 | ||||||||||||||||||||||||||
| Share-based cash and non-cash compensation | 8,534 | 311 | 8,223 | 10,290 | 1,148 | 9,142 | ||||||||||||||||||||||||||
| Adjusted EBITDA | $ | 40,321 | $ | 25,626 | $ | 14,695 | 57.3 | % | $ | 180,119 | $ | 130,590 | $ | 49,529 | 37.9 | % | ||||||||||||||||
| # - Variance greater than 100% or not meaningful. | ||||||||||||||||||||||||||||||||
U.S. Segment Results - For the three months ended December 31, 2017 and 2016
Fourth quarter U.S. revenues grew by $42.1 million or 25.7% to $205.8 million.
U.S. revenue growth was driven by a $49.4 million, or 18.0%, increase in gross combined loans receivable (excluding past due loans) to $323.6 million at December 31, 2017 compared to $274.2 million in the prior year period. We experienced strong volume growth in Unsecured Installment originations, which increased year-over-year $131.9 million, or 27.4%. Secured Installment originations grew $45.9 million, or 33.2%, compared to the same period a year ago.
The increase of $21.7 million, or 33.3%, in provision for losses was primarily driven by the increase in combined loans receivable above, but was also affected by the Q1 Loss Recognition Change as further described in the Prospectus filed with the S.E.C. pursuant to Rule 424(b)(4) on December 8, 2017. Core increases in origination volumes for installment loans increased provision year over year by approximately $10 million. The Q1 Loss Recognition Change requires higher provision rates to compensate for accrued interest on delinquent loans through charge off (the ‘rate effect’). The rate effect and performance of past due receivable at the time of the change in estimate increased provision by approximately $12 million.
U.S. cost of providing services remained consistent with the same period in the prior year. The total cost of providing services for the three months ended December 31, 2017 were $53.1 million, a slight decrease of $0.7 million, or 1.3% compared to $53.8 million for the year ended December 31, 2016.
All other U.S. operating expenses were $64.4 million for the three months ended December 31, 2017, an increase of $25.1 million, compared to $39.4 million in the prior year period. Excluding the effects of the items discussed previously in "Reconciliation of Net Income and Diluted Earnings per Share to Adjusted Net Income and Adjusted Diluted Earnings per Share, non-GAAP measures" applicable to the U.S. as indicated in the Segment table above, Corporate, district and other operating expenses rose $6.4 million. This increase includes year-over-year incremental variable compensation expense of $2.6 million for 2017 performance versus the Company's Annual Operating Plan. Remaining operating expenses increased $3.6 million or 16.5% primarily due to increased technology and analytics headcount. Interest expense increased because of higher debt balances.
U.S. Segment Results - For the year ended December 31, 2017 and 2016
Full year U.S. revenues grew by $130.9 million, or 21.6% to $737.7 million. U.S. revenue growth was driven by a $49.4 million, or 18.0%, increase in gross combined loans receivable (excluding past due loans) to $323.6 million at December 31, 2017 compared to $274.2 million in the prior year period. We experienced strong volume growth in Unsecured Installment originations, which increased year-over-year $131.9 million, or 27.4%. Secured Installment originations grew $45.9 million, or 33.2%, compared to the same period a year ago.
The increase of $59.7 million, or 28.8%, in provision for losses was primarily driven by the aforementioned increase in gross combined loans receivable and related origination volumes as well as the Q1 Loss Recognition Change.
U.S. cost of providing services for the year ended December 31, 2017 were $203.0 million, an increase of $8.3 million, or 4.3% compared to $194.7 million for the year ended December 31, 2016. This increase was due primarily to $5.8 million (19.1%) higher marketing spend, as well as increases in volume-driven expenses and increases in store security and maintenance costs.
All other U.S. operating expenses were $215.8 million for the year ended December 31, 2017, an increase of $68.2 million, or 46.2%, compared to $147.6 million in the prior year period. Excluding the effects of the items discussed previously in "Reconciliation of Net Income and Diluted Earnings per Share to Adjusted Net Income and Adjusted Diluted Earnings per Share, non-GAAP measures" applicable to the U.S. as indicated in the Segment table above, Corporate, district and other operating expenses rose $13.6 million, or 15.6%, primarily due to increased technology and analytics headcount.
| Canada Segment Results | Three Months Ended December 31, | Year Ended December 31, | ||||||||||||||||||||||||||||||
| Change | Change | |||||||||||||||||||||||||||||||
| (dollars in thousands) | 2017 | 2016 | $ | % | 2017 | 2016 | $ | % | ||||||||||||||||||||||||
| Revenue | $ | 50,589 | $ | 47,226 | $ | 3,363 | 7.1 | % | $ | 186,408 | $ | 188,078 | $ | (1,670 | ) | (0.9 | )% | |||||||||||||||
| Provision for losses | 8,829 | 12,124 | (3,295 | ) | (27.2 | )% | 45,075 | 39,917 | 5,158 | 12.9 | % | |||||||||||||||||||||
| Net revenue | 41,760 | 35,102 | 6,658 | 19.0 | % | 141,333 | 148,161 | (6,828 | ) | (4.6 | )% | |||||||||||||||||||||
| Advertising costs | 3,471 | 2,375 | 1,096 | 46.1 | % | 10,415 | 8,695 | 1,720 | 19.8 | % | ||||||||||||||||||||||
| Non-advertising costs of providing services | 16,250 | 15,038 | 1,212 | 8.1 | % | 62,968 | 60,827 | 2,141 | 3.5 | % | ||||||||||||||||||||||
| Total cost of providing services | 19,721 | 17,413 | 2,308 | 13.3 | % | 73,383 | 69,522 | 3,861 | 5.6 | % | ||||||||||||||||||||||
| Gross margin | 22,039 | 17,689 | 4,350 | 24.6 | % | 67,950 | 78,639 | (10,689 | ) | (13.6 | )% | |||||||||||||||||||||
| Corporate, district and other | 4,545 | 3,481 | 1,064 | 30.6 | % | 16,952 | 17,174 | (222 | ) | (1.3 | )% | |||||||||||||||||||||
| Interest expense | 59 | 12 | 47 | # | 201 | 85 | 116 | # | ||||||||||||||||||||||||
| Restructuring and other costs | — | (35 | ) | 35 | # | — | 898 | (898 | ) | # | ||||||||||||||||||||||
| Total operating expense | 4,604 | 3,458 | 1,146 | 33.1 | % | 17,153 | 18,157 | (1,004 | ) | (5.5 | )% | |||||||||||||||||||||
| Segment operating income | 17,435 | 14,231 | 3,204 | 22.5 | % | 50,797 | 60,482 | (9,685 | ) | (16.0 | )% | |||||||||||||||||||||
| Interest expense | 59 | 12 | 47 | # | 201 | 85 | 116 | # | ||||||||||||||||||||||||
| Depreciation and amortization | 1,157 | 1,065 | 92 | 8.6 | % | 4,546 | 4,827 | (281 | ) | (5.8 | )% | |||||||||||||||||||||
| EBITDA | 18,651 | 15,308 | 3,343 | 21.8 | % | 55,544 | 65,394 | (9,850 | ) | (15.1 | )% | |||||||||||||||||||||
| Restructuring and other costs | — | (35 | ) | 35 | # | — | 898 | (898 | ) | # | ||||||||||||||||||||||
| Share-based cash and non-cash compensation | 156 | — | 156 | # | 156 | — | 156 | # | ||||||||||||||||||||||||
| Other adjustments | (417 | ) | (14 | ) | (403 | ) | # | (1,071 | ) | (373 | ) | (698 | ) | # | ||||||||||||||||||
| Adjusted EBITDA | $ | 18,390 | $ | 15,259 | $ | 3,131 | 20.5 | % | $ | 54,629 | $ | 65,919 | $ | (11,290 | ) | (17.1 | )% | |||||||||||||||
| # - Variance greater than 100% or not meaningful. | ||||||||||||||||||||||||||||||||
Canada Segment Results - For the three months ended December 31, 2017 and 2016
Revenue in Canada was affected by product transition in Alberta from Single-Pay loans to Unsecured Installment loans and the impact of regulatory rate changes in Ontario and British Columbia.
Non-Alberta Single-Pay revenue increased $0.2 million, or 0.5% to $38.9 million for 2017 and was affected by lower rates from provincial regulatory changes effective January 1, 2017. The impact of the rate changes was offset by higher origination volumes resulting in a modest increase in related revenue. Single-Pay ending receivables (excluding Alberta) increased $9.1 million, or 20.9%, to $52.6 million from $43.5 million in the prior year period.
Because of regulatory changes in Alberta, we converted Single-Pay customers to Unsecured Installment loans during the first week of December 2016, resulting in $22.7 million of Unsecured Installment loans outstanding at the end of 2016. As of December 31, 2017, $43.7 million of Unsecured Installment and Open-End receivables were outstanding in Alberta.
The provision for losses decreased $3.3 million or 27.2% to $8.8 million for the three months ended December 31, 2017 compared to $12.1 million in the prior year period. The decrease was primarily due to relative loan growth (December 2016 included provisioning on the conversion of $8.9 million of Single-Pay to $18.1 million of Unsecured Installment loan balances). In addition, Unsecured Installment provision rates and allowance coverage has normalized as the portfolio has seasoned and we have better insight into payment performance.
The cost of providing services in Canada increased $2.3 million, or 13.3%, to $19.7 million for the three months ended December 31, 2017, compared to $17.4 million in the prior year period. The increase was due primarily to $1.1 million, or 46.1% of higher marketing expense compared to the prior year period, as well as an increase in occupancy expense, based on a higher number of stores in operation during 2017.
Operating expenses increased $1.1 million, or 33.1%, to $4.6 million in the year ended December 31, 2017, from $3.5 million in the prior year period, due to $0.4 million of incremental bonus expense for 2017 performance, $0.2 million of share-based compensation and elevated spend on third party collections.
Canada Segment Results - For the year ended December 31, 2017 and 2016
Revenue in Canada was affected by product transition in Alberta from Single-Pay loans to Unsecured Installment loans and the impact of regulatory rate changes in Ontario and British Columbia.
Non-Alberta Single-Pay revenue decreased $1.1 million, or 0.8% to $146.2 million for 2017 and was affected by lower rates from provincial regulatory changes effective January 1, 2017. The impact of the rate changes was offset by higher origination volumes resulting in a modest decrease in related revenue. Single-Pay ending receivables (excluding Alberta) increased $9.1 million, or 20.9%, to $52.6 million from $43.5 million in the prior year period.
Because of regulatory changes in Alberta, we converted Single-Pay customers to Unsecured Installment loans during the first week of December 2016, resulting in $22.7 million of Unsecured Installment loans outstanding at the end of 2016. As of December 31, 2017, $43.7 million of Unsecured Installment and Open-End receivables were outstanding in Alberta.
The provision for losses rose $5.2 million or 12.9% to $45.1 million for full year 2017 compared to $39.9 million in the prior year period. As in the U.S., the increase was due to higher loan origination volume and the shift in Alberta from Single Pay to Unsecured Installment loans.
The cost of providing services in Canada increased $3.9 million, or 5.6%, to $73.4 million for the year ended December 31, 2017, compared to $69.5 million in the prior year period due primarily to an increase in occupancy expense, based on a higher number of stores in operation during 2017 as compared to the prior year, as well as an increase in store maintenance costs and higher marketing spend.
Operating expenses decreased $1.0 million, or 5.5%, to $17.2 million in the year ended December 31, 2017, from $18.2 million in the prior year period, due to the consolidation of certain back-office functions during the third quarter of 2016.
| U.K. Segment Results | Three Months Ended December 31, | Year Ended December 31, | ||||||||||||||||||||||||||||||
| Change | Change | |||||||||||||||||||||||||||||||
| (dollars in thousands) | 2017 | 2016 | $ | % | 2017 | 2016 | $ | % | ||||||||||||||||||||||||
| Revenue | $ | 10,584 | $ | 7,987 | $ | 2,597 | 32.5 | % | $ | 39,496 | $ | 33,720 | $ | 5,776 | 17.1 | % | ||||||||||||||||
| Provision for losses | 4,041 | 3,713 | 328 | 8.8 | % | 13,660 | 10,624 | 3,036 | 28.6 | % | ||||||||||||||||||||||
| Net revenue | 6,543 | 4,274 | 2,269 | 53.1 | % | 25,836 | 23,096 | 2,740 | 11.9 | % | ||||||||||||||||||||||
| Advertising costs | 1,436 | 1,228 | 208 | 16.9 | % | 5,495 | 4,886 | 609 | 12.5 | % | ||||||||||||||||||||||
| Non-advertising costs of providing services | 843 | 2,264 | (1,421 | ) | (62.8 | )% | 6,269 | 7,921 | (1,652 | ) | (20.9 | )% | ||||||||||||||||||||
| Total cost of providing services | 2,279 | 3,492 | (1,213 | ) | (34.7 | )% | 11,764 | 12,807 | (1,043 | ) | (8.1 | )% | ||||||||||||||||||||
| Gross margin | 4,264 | 782 | 3,482 | # | 14,072 | 10,289 | 3,783 | 36.8 | % | |||||||||||||||||||||||
| Corporate, district and other | 4,127 | 2,782 | 1,345 | 48.3 | % | 17,218 | 18,561 | (1,343 | ) | (7.2 | )% | |||||||||||||||||||||
| Interest income | (1 | ) | (6 | ) | (5 | ) | (83.3 | )% | (12 | ) | (27 | ) | (15 | ) | (55.6 | )% | ||||||||||||||||
| Restructuring and other costs | — | 488 | (488 | ) | # | 7,393 | 994 | 6,399 | # | |||||||||||||||||||||||
| Total operating expense | 4,126 | 3,264 | 862 | 26.4 | % | 24,599 | 19,528 | 5,071 | 26.0 | % | ||||||||||||||||||||||
| Segment operating income (expense) | 138 | (2,482 | ) | 2,620 | # | (10,527 | ) | (9,239 | ) | (1,288 | ) | 13.9 | % | |||||||||||||||||||
| Interest income | (1 | ) | (6 | ) | (5 | ) | (83.3 | )% | (12 | ) | (27 | ) | (15 | ) | (55.6 | )% | ||||||||||||||||
| Depreciation and amortization | 117 | 201 | (84 | ) | (41.8 | )% | 648 | 882 | (234 | ) | (26.5 | )% | ||||||||||||||||||||
| EBITDA | 254 | (2,287 | ) | 2,541 | # | (9,891 | ) | (8,384 | ) | (1,507 | ) | (18.0 | )% | |||||||||||||||||||
| Other adjustments | (7 | ) | 15 | (22 | ) | # | (35 | ) | 242 | (277 | ) | # | ||||||||||||||||||||
| Restructuring and other costs | — | 488 | (488 | ) | # | 7,393 | 994 | 6,399 | # | |||||||||||||||||||||||
| Adjusted EBITDA | $ | 247 | $ | (1,784 | ) | $ | 2,031 | # | $ | (2,533 | ) | $ | (7,148 | ) | $ | 4,615 | 64.6 | % | ||||||||||||||
| # - Variance greater than 100% or not meaningful | ||||||||||||||||||||||||||||||||
U.K. Segment Results - For the three months ended December 31, 2017 and 2016
U.K. revenue improved $2.6 million, or 32.5% to $10.6 million for the year ended December 31, 2017 from $8.0 million in the prior year period. On a constant currency basis, revenue was up $1.9 million, or 24.0%. Provision for losses increased $0.3 million, or 8.8%, and increased $0.5 million, or 15.8% on a constant currency basis, due to growth in Installment Loan receivables.
The cost of providing services in the U.K. decreased $1.2 million, or 34.7%, for the three months ended December 31, 2017 as compared to prior year period. The decrease is primarily because the 13 remaining stores in the U.K. were closed in the third quarter of 2017. On a constant currency basis the cost of providing services decreased $1.4 million, or 38.9%.
Corporate, district and other expenses of $4.1 million for the fourth quarter of 2017 are consistent with quarterly run rates for the full year 2017 and represent normal baseline costs for the U.K.
U.K. Segment Results - For the year ended December 31, 2017 and 2016
U.K. revenue improved $5.8 million, or 17.1% to $39.5 million for the year ended December 31, 2017 from $33.7 million in the prior year period. On a constant currency basis, revenue was up $7.8 million, or 23.0%. Provision for losses increased $3.0 million, or 28.6%, and increased $3.7 million, or 34.5% on a constant currency basis, due to growth in Installment Loan receivables.
The cost of providing services in the U.K. decreased slightly from the prior year period because of third quarter 2017 store closures. On a constant currency basis the cost of providing services decreased $0.4 million, or 3.1%.
Operating expenses increased $5.1 million, or 26.0%, from the prior year period, and on a constant currency basis increased $6.3 million, or 32.4%, due to restructuring costs from closure of the 13 remaining stores during the third quarter of 2017. Excluding the store closure costs, operating expenses decreased $1.3 million (7.2%) because of reduced headquarters and contact center headcount and lower professional fees.
| CURO GROUP HOLDINGS CORP. AND SUBSIDIARIES | ||||||||||
| CONSOLIDATED BALANCE SHEETS | ||||||||||
(in thousands, except share data) | ||||||||||
| December 31, 2017 | December 31, 2016 | |||||||||
| ASSETS | ||||||||||
| Cash | $ | 162,374 | $ | 193,525 | ||||||
| Restricted cash (includes restricted cash of consolidated VIEs of $6,871 and $2,770 as of December 31, 2017 and 2016, respectively) | 12,117 | 7,828 | ||||||||
| Gross loans receivable (includes loans of consolidated VIEs of $214,066 and $130,199 as of December 31, 2017 and 2016, respectively) | 432,837 | 286,196 | ||||||||
| Less: allowance for loan losses (includes allowance for losses of consolidated VIEs of $46,140 and $22,134 as of December 31, 2017 and 2016, respectively) | (69,568 | ) | (39,192 | ) | ||||||
| Loans receivable, net | 363,269 | 247,004 | ||||||||
| Deferred income taxes | 772 | 12,635 | ||||||||
| Income taxes receivable | 3,455 | 9,378 | ||||||||
| Prepaid expenses and other | 42,512 | 39,248 | ||||||||
| Property and equipment, net | 87,086 | 95,896 | ||||||||
| Goodwill | 145,607 | 141,554 | ||||||||
| Other intangibles, net of accumulated amortization of $41,891 and $37,670 | 32,769 | 30,901 | ||||||||
| Other | 9,770 | 2,829 | ||||||||
| Total Assets | $ | 859,731 | $ | 780,798 | ||||||
| LIABILITIES AND STOCKHOLDERS' EQUITY | ||||||||||
| Accounts payable and accrued liabilities | $ | 55,792 | $ | 42,663 | ||||||
| Deferred revenue | 11,984 | 12,342 | ||||||||
| Income taxes payable | 4,120 | 1,372 | ||||||||
| Current maturities of long-term debt | — | 147,771 | ||||||||
| Accrued interest (includes accrued interest of consolidated VIEs of $1,266 and $775 as of December 31, 2017 and 2016, respectively) | 25,467 | 8,183 | ||||||||
| Credit services organization guarantee liability | 17,795 | 17,052 | ||||||||
| Deferred rent | 11,577 | 11,868 | ||||||||
| Long-term debt (includes long-term debt and issuance costs of consolidated VIEs of $124,590 and $4,188 and $68,311 and $5,257 as of December 31, 2017 and 2016, respectively) | 706,225 | 477,136 | ||||||||
| Subordinated shareholder debt | 2,381 | 2,227 | ||||||||
| Other long-term liabilities | 5,768 | 5,016 | ||||||||
| Deferred tax liabilities | 11,486 | 14,313 | ||||||||
| Total Liabilities | 852,595 | 739,943 | ||||||||
| Commitments and contingencies | ||||||||||
| Stockholders' Equity | ||||||||||
| Preferred stock - $0.001 par value; 25,000,000 and no shares authorized, respectively, and no shares were issued at either period end | — | — | ||||||||
| Common stock - $0.001 par value; 225,000,000 and 72,000,000 shares authorized, and 44,561,419 and 37,894,752 issued and outstanding, at the respective period ends | 8 | 1 | ||||||||
| Dividends in excess of paid-in capital | 46,079 | (35,996 | ) | |||||||
| Retained earnings | 3,988 | 136,835 | ||||||||
| Accumulated other comprehensive loss | (42,939 | ) | (59,985 | ) | ||||||
| Total Stockholders' Equity | 7,136 | 40,855 | ||||||||
| Total Liabilities and Stockholders' Equity | $ | 859,731 | $ | 780,798 | ||||||
Balance Sheet Changes - December 31, 2017 compared to December 31, 2016
Cash - Cash decreased from 2016 primarily because of cash used in the redemption and refinancing of the Company’s 12.00% Senior Cash Pay Notes due 2017 and CURO Intermediate’s 10.75% Senior Secured Notes due 2018 (“Former Senior Secured Notes”). On February 15, 2017, CURO Financial Technologies Corp. ("CFTC"), a wholly-owned subsidiary of the Company, issued $470.0 million of 12.00% Senior Secured Notes due 2022. The proceeds, along with $122.5 million of company cash, were used to redeem the $539.9 million outstanding of Former Senior Secured Notes (including accrued interest, original-issue discount, prepayment premium and transaction costs). The decrease in cash from this refinancing was offset partially by cash generated by operations during 2017 and net proceeds after transaction costs of $81.1 million from the Company’s initial public offering of 6,666,667 shares of common stock at a price of $14.00 per share. On November 2, 2017, CFTC issued $135.0 million of additional 12.00% Senior Secured Notes due 2022. The proceeds of the notes offering and related issuance premium were used to pay a $140.0 million cash dividend to the Company and, ultimately, the Company's stockholders.
Gross Loans Receivable and Allowance for Loan Losses - The Company originated $780.7 million and $184.3 million of Unsecured and Secured Installment Loans, respectively, during 2017 as compared to $533.4 million and $138.4 million in the prior year. As explained in the Loan Volume and Portfolio Performance Analysis section above, changes in Gross Loans Receivable and related Allowance for Loan Losses were due to high customer demand and loan origination volumes during 2017 that were concentrated in Installment Loans.
Other Assets - Other assets increased primarily because of the equity investment in Cognical Holdings, Inc. We made a $5.0 million investment on April 20, 2017 and an additional $0.6 million investment in October 2017 that increased the Company's equity ownership from 8.9% to 9.4%. Cognical Holdings, Inc. operates as a business under an online website, www.zibby.com, that facilities the purchase of household items and by underbanked consumers.
Long-term debt (including current maturities) and Accrued Interest - Changes from year-end 2016 are due to the refinancing of the Former Senior Secured Notes and the conversion of the ABL Facility to the Non-Recourse U.S. SPV Facility. For more information about the Company's long term debt, see Note 11, “Long-Term Debt” of the Notes to Interim Consolidated Financial Statements included in the prospectus dated December 8, 2017.
About CURO
CURO Group Holdings Corp. (NYSE: CURO), operating in three countries and powered by its fully integrated technology platform, is a market leader by revenues in providing short-term credit to underbanked consumers. In 1997, the Company was founded in Riverside, California by three Wichita, Kansas childhood friends to meet the growing consumer need for short-term loans. Their success led to opening stores across the United States, and expanding to offer online loans and financial services across three countries. Today, CURO combines its market expertise with a fully integrated technology platform, omni-channel approach and advanced credit decisioning to provide an array of short-term credit products across all mediums. CURO operates under a number of brands including Speedy Cash, Rapid Cash, Cash Money, LendDirect, Avío Credit, WageDayAdvance, Juo Loans, and Opt+. With over 20 years of operating experience, CURO provides financial freedom to the underbanked.
Conference Call
CURO will host a conference call to discuss these results at 8:30 a.m. Eastern Time tomorrow, February 2, 2018. The live webcast of the call can be accessed at the CURO Investor Relations website at http://ir.curo.com/.
You may access the call at 1-866-807-9684 (1-412-317-5415 for international callers). Please ask to join the CURO Group Holdings call. A replay of the conference call will be available until February 9, 2018, at 11:59 p.m. Eastern Time. An archived version of the webcast will be available on the CURO Investor Relations website for 90 days. You may access the conference call replay at 1-877-344-7529 (1-412-317-0088 for international callers). The replay access code is 10116490.
Final Results
The financial results discussed herein are presented on a preliminary basis; final data will be included in the Company’s Annual Report on Form 10-K for the period ended December 31, 2017.
Forward-Looking Statements
This press release may contain forward-looking statements within the meaning of the Private Securities Litigation Reform Act of 1995. These statements may include, without limitation, any statements preceded by, followed by or including words such as “target,” “believe,” “expect,” “aim,” “intend,” “may,” “anticipate,” “assume,” “budget,” “continue,” “estimate,” “future,” “objective,” “outlook,” “plan,” “potential,” “predict,” “project,” “will,” “can have,” “likely,” “should,” “would,” “could” and other words and terms of similar meaning or the negative thereof. Such forward-looking statements involve known and unknown risks, uncertainties and other important factors beyond the Company’s control, as discussed by the Company’s filings with SEC, that could cause the Company’s actual results, performance or achievements to be materially different from the expected results, performance or achievements expressed or implied by such forward-looking statements. Such forward-looking statements are based on numerous assumptions regarding the Company’s present and future business strategies and the environment in which it will operate in the future. Any forward-looking statement made in this press release speaks only as the date hereof.
Forward-looking statements reflect our current expectations regarding future events, results or outcomes. These expectations may or may not be realized. Some of these expectations may be based upon assumptions or judgments that prove to be incorrect. In addition, our business and operations involve numerous risks and uncertainties, many of which are beyond our control, which could result in our expectations not being realized or otherwise materially affect our financial condition, results of operations and cash flows. Except as required by law, the Company assumes no obligation to update these forward-looking statements, or to update the reasons actual results could differ materially from those anticipated in the forward-looking statements, even if new information becomes available in the future.
Our forward-looking statements are not guarantees of future performance, and actual events, results and outcomes may differ materially from our expectations suggested in any forward-looking statements due to a variety of factors, including, among others, those set forth in the section entitled “Risk Factors” in our Prospectus filed pursuant to Rule 424(b)(4) on December 8, 2017.
Non-GAAP Financial Measures
In addition to the financial information prepared in conformity with U.S. GAAP, we provide certain “non-GAAP financial measures,” including:
- Adjusted Net Income (Net Income minus certain non-cash and other adjusting items)
- Adjusted Earnings per share (Earnings per share minus the per share impacts of certain non-cash and other adjusting items)
- EBITDA (earnings before interest, income taxes, depreciation and amortization);
- Adjusted EBITDA (EBITDA plus or minus certain non-cash and other adjusting items); and
- Gross Combined Loans Receivable (includes loans originated by third-party lenders through CSO programs which are not included in the consolidated financial statements).
We believe that presentation of non-GAAP financial information is meaningful and useful in understanding the activities and business metrics of the Company's operations. We believe that these non-GAAP financial measures reflect an additional way of viewing aspects of the business that, when viewed with its GAAP results, provide a more complete understanding of factors and trends affecting the business.
We believe that investors regularly rely on non-GAAP financial measures, such as Adjusted Net Income, Adjusting Earnings per Share, EBITDA and Adjusted EBITDA, to assess operating performance and that such measures may highlight trends in the business that may not otherwise be apparent when relying on financial measures calculated in accordance with GAAP. In addition, we believe that the adjustments shown below are useful to investors in order to allow them to compare the Company's financial results during the periods shown without the effect of each of these income or expense items. In addition, we believe that Adjusted Net Income, Adjusting Earnings per Share, EBITDA and Adjusted EBITDA are frequently used by securities analysts, investors and other interested parties in the evaluation of public companies in the Company's industry, many of which present Adjusted Net Income, Adjusting Earnings per Share, EBITDA and/or Adjusted EBITDA when reporting their results.
In addition to reporting loans receivable information in accordance with GAAP, we provide Gross Combined Loans Receivable consisting of owned loans receivable plus loans originated by third-party lenders through the CSO programs, which we guarantee but do not include in the Consolidated Financial Statements. Management believes this analysis provides investors with important information needed to evaluate overall lending performance.
We provide non-GAAP financial information for informational purposes and to enhance understanding of the GAAP consolidated financial statements. Adjusted Net Income, Adjusting Earnings per Share, EBITDA, Adjusted EBITDA and Gross Combined Loans Receivable should not be considered as alternatives to income from continuing operations, segment operating income, or any other performance measure derived in accordance with U.S. GAAP, or as an alternative to cash flows from operating activities or any other liquidity measure derived in accordance with U.S. GAAP. Rather, these measures should be considered in addition to results prepared in accordance with U.S. GAAP, but should not be considered a substitute for, or superior to, U.S. GAAP results. Readers should consider the information in addition to, but not instead of or superior to, the financial statements prepared in accordance with GAAP. This non-GAAP financial information may be determined or calculated differently by other companies, limiting the usefulness of those measures for comparative purposes.
Description and Reconciliations of Non-GAAP Financial Measures
Adjusted Net Income, Adjusting Earnings per Share, EBITDA and Adjusted EBITDA Measures have limitations as analytical tools, and you should not consider these measures in isolation or as a substitute for analysis of the Company's income or cash flows as reported under U.S. GAAP. Some of these limitations are:
- they do not include cash expenditures or future requirements for capital expenditures or contractual commitments;
- they do not include changes in, or cash requirements for working capital needs;
- they do not include the interest expense, or the cash requirements necessary to service interest or principal payments on debt;
- depreciation and amortization are non-cash expense items reported in the statements of cash flows; and
- other companies in the Company's industry may calculate these measures differently, limiting their usefulness as comparative measures.
We evaluate stores based on revenue per store, provision for losses at each store and store-level EBITDA, with consideration given to the length of time a store has been open and its geographic location. We monitor newer stores for their progress to profitability and their rate of revenue growth.
We believe Adjusted Net Income, Adjusting Earnings per Share, EBITDA and Adjusted EBITDA are used by investors to analyze operating performance and evaluate the Company's ability to incur and service debt and the capacity for making capital expenditures. Adjusted EBITDA is also useful to investors to help assess the Company's estimated enterprise value. The computation of Adjusted EBITDA as presented in this release may differ from the computation of similarly-titled measures provided by other companies.
(CURO-NWS)
View source version on businesswire.com: http://www.businesswire.com/news/home/20180201006717/en/
Contacts:
Investor Relations:
Roger
Dean, 844-200-0342
Executive Vice President & Chief Financial
Officer
IR@curo.com
