 ( click to enlarge )
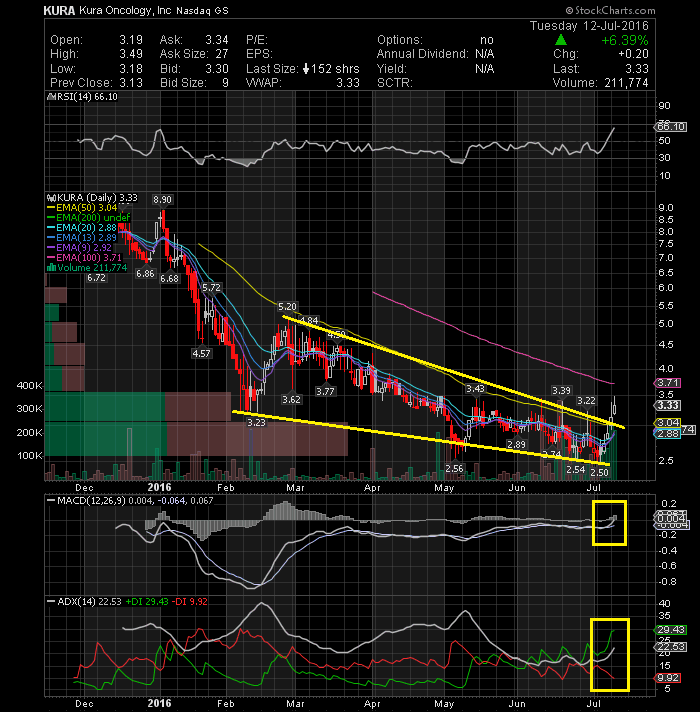
Kura Oncology Inc (NASDAQ:KURA) is gaining momentum and couldkeep running. This week, the stock has finally broke out of the falling wedge formation accompanied by high volume, as we see on its daily chart above. Technical indicators point to KURA being in an upward trend already, but in my opinion, this could be just the beginning of a breakout that could bring good returns. This company has78.48M in cash or nearly $4 per share and Zero debt. I have been accumulating this stock as evidenced by my tweets.
 ( click to enlarge )
Box Inc (NYSE:BOX) broke out of a bottom/accumulation pattern. With the RSI rising off an oversold position and with MACD crossing over the signal line, the stock looks prime for a continuation of Tuesday's rally. Plus, we saw unusual options activity (Dec $13). An initial resistance can be found at 11.2.
 ( click to enlarge )
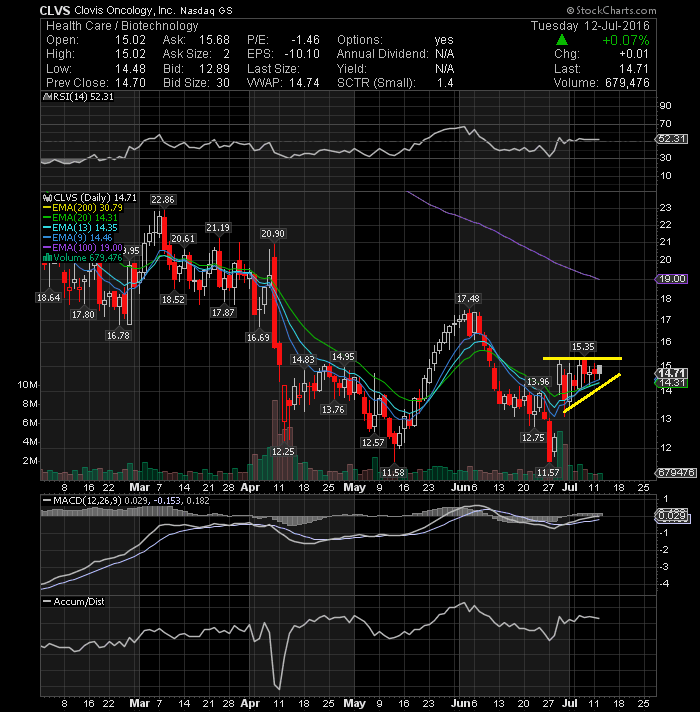
Clovis Oncology Inc (NASDAQ:CLVS) has formed an interesting bullish pattern over recent weeks. A breakout above the upper line of the triangle is a signal that there is a potential medium-term trend change taking place.
 ( click to enlarge )
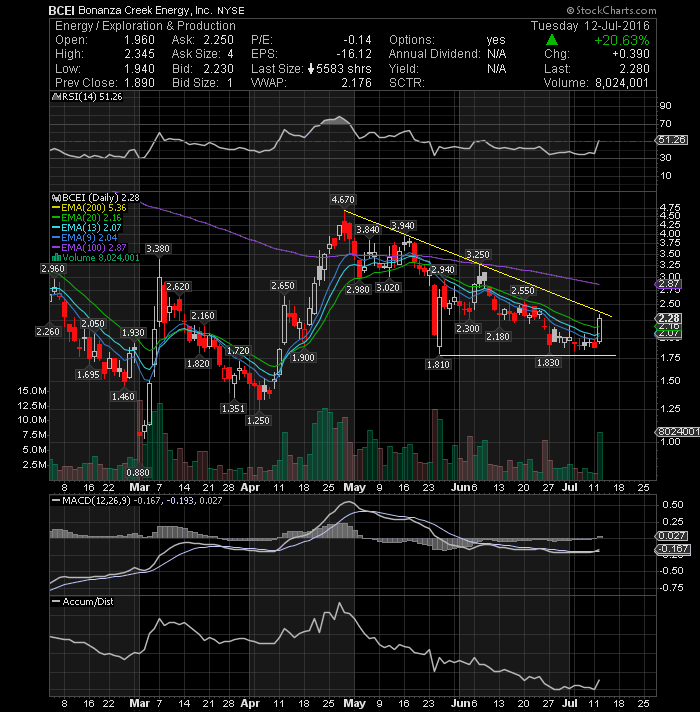
Bonanza Creek Energy Inc (NYSE:BCEI) Potential trend reversal in this stock. Next technical buy area is above this trendline on heavy volume.
 ( click to enlarge )
3D Systems Corporation (NYSE:DDD) broke out of a consolidation range, as the stock closed up $1 on decent volume. I will be watching it tomorrow for a continuation of this breakout. The short-term trend is still bullish as the stock is still on top of all EMAs. Plus, the MACD is rising on on positive territory and the RSI is moving up. I think the stock has room to go higher. Watch the stock closely on Wednesday.
 ( click to enlarge )
Splunk Inc (NASDAQ:SPLK) had a great move on the upside and closed at $59. The stock is setting up to break out and has one more level to go, which is $60.
 ( click to enlarge )
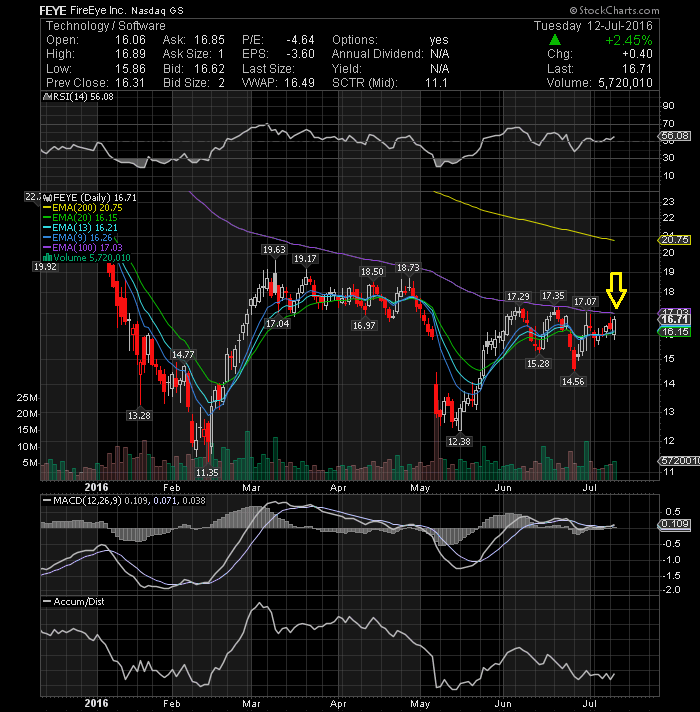
FireEye Inc (NASDAQ:FEYE) Setting up a possible resistance breakout trade. Long over 17.03 (declining 100-day EMA).
If you want to contact me for advertising opportunities on blog or twitter, then get in touch via email
Disclaimer : This is not an investment advisory, and should not be used to make investment decisions. Information in AC Investor Blog is often opinionated and should be considered for information purposes only. No stock exchange anywhere has approved or disapproved of the information contained herein. There is no express or implied solicitation to buy or sell securities. The charts provided here are not meant for investment purposes and only serve as technical examples. Don't consider buying or selling any stock without conducting your own due diligence.
Thanks for visiting AC Investor Blog.
AC
