
Business transformation services company Genpact (NYSE: G) reported Q4 CY2025 results topping the market’s revenue expectations, with sales up 5.6% year on year to $1.32 billion. On the other hand, next quarter’s revenue guidance of $1.29 billion was less impressive, coming in 0.5% below analysts’ estimates. Its non-GAAP profit of $0.97 per share was 3.8% above analysts’ consensus estimates.
Is now the time to buy Genpact? Find out by accessing our full research report, it’s free.
Genpact (G) Q4 CY2025 Highlights:
- Revenue: $1.32 billion vs analyst estimates of $1.31 billion (5.6% year-on-year growth, 0.8% beat)
- Adjusted EPS: $0.97 vs analyst estimates of $0.93 (3.8% beat)
- Revenue Guidance for Q1 CY2026 is $1.29 billion at the midpoint, below analyst estimates of $1.30 billion
- Adjusted EPS guidance for Q1 CY2026 is $0.93 at the midpoint, above analyst estimates of $0.92
- Operating Margin: 14.8%, in line with the same quarter last year
- Free Cash Flow Margin: 20.4%, up from 14.6% in the same quarter last year
- Market Capitalization: $6.61 billion
"2025 was a strong year for Genpact driven by disciplined execution, accelerating innovation, and broad-based demand for our solutions. Advanced Technology Solutions grew 17% year over year, as we continue to rapidly scale data, AI, and domain-driven agentic solutions," said Balkrishan "BK" Kalra, President and CEO, Genpact.
Company Overview
Originally spun off from General Electric in 2005 to provide business process services, Genpact (NYSE: G) is a global professional services firm that helps businesses transform their operations through digital technology, AI, and data analytics solutions.
Revenue Growth
A company’s long-term sales performance is one signal of its overall quality. Any business can put up a good quarter or two, but many enduring ones grow for years.
With $5.08 billion in revenue over the past 12 months, Genpact is one of the larger companies in the business services industry and benefits from a well-known brand that influences purchasing decisions.
As you can see below, Genpact’s 6.5% annualized revenue growth over the last five years was decent. This shows its offerings generated slightly more demand than the average business services company, a helpful starting point for our analysis.
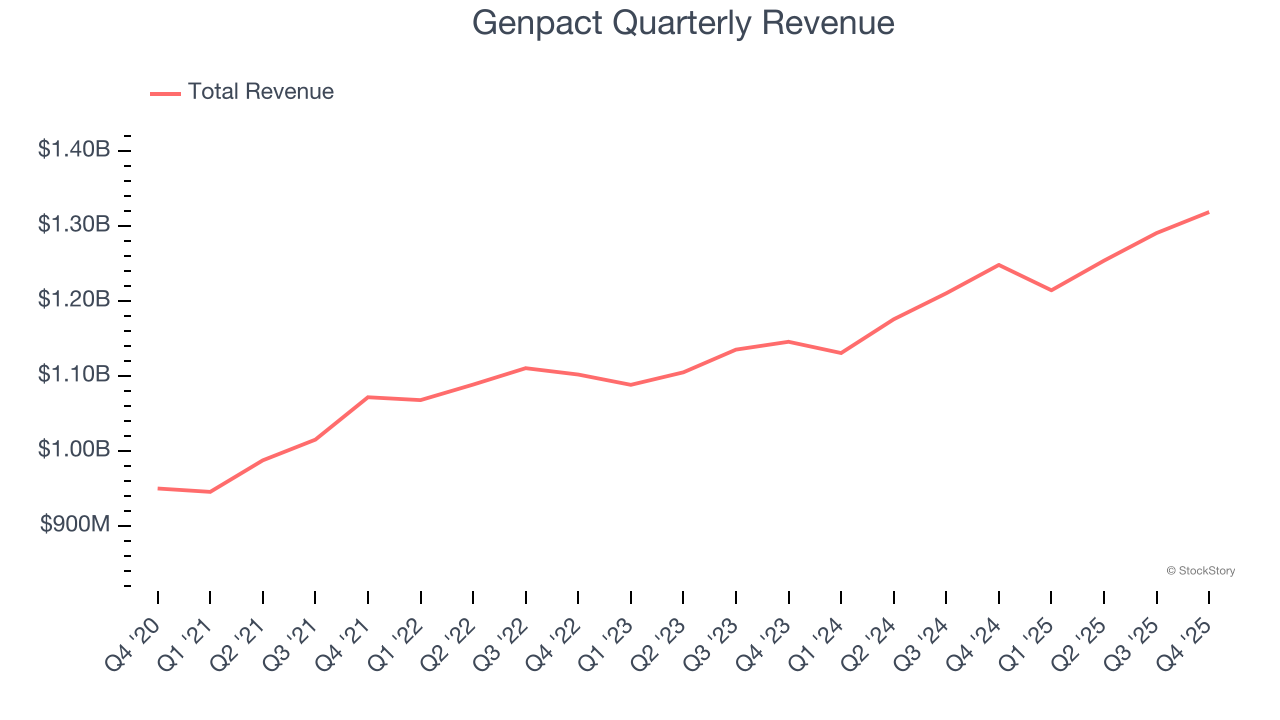
Long-term growth is the most important, but within business services, a half-decade historical view may miss new innovations or demand cycles. Genpact’s annualized revenue growth of 6.5% over the last two years aligns with its five-year trend, suggesting its demand was stable. 
This quarter, Genpact reported year-on-year revenue growth of 5.6%, and its $1.32 billion of revenue exceeded Wall Street’s estimates by 0.8%. Company management is currently guiding for a 6% year-on-year increase in sales next quarter.
Looking further ahead, sell-side analysts expect revenue to grow 7% over the next 12 months, similar to its two-year rate. This projection is above average for the sector and suggests its newer products and services will help sustain its recent top-line performance.
The 1999 book Gorilla Game predicted Microsoft and Apple would dominate tech before it happened. Its thesis? Identify the platform winners early. Today, enterprise software companies embedding generative AI are becoming the new gorillas. a profitable, fast-growing enterprise software stock that is already riding the automation wave and looking to catch the generative AI next.
Adjusted Operating Margin
Genpact’s adjusted operating margin might fluctuated slightly over the last 12 months but has remained more or less the same, averaging 16.9% over the last five years. This profitability was top-notch for a business services business, showing it’s an well-run company with an efficient cost structure.
Looking at the trend in its profitability, Genpact’s adjusted operating margin might fluctuated slightly but has generally stayed the same over the last five years. This raises questions about the company’s expense base because its revenue growth should have given it leverage on its fixed costs, resulting in better economies of scale and profitability.
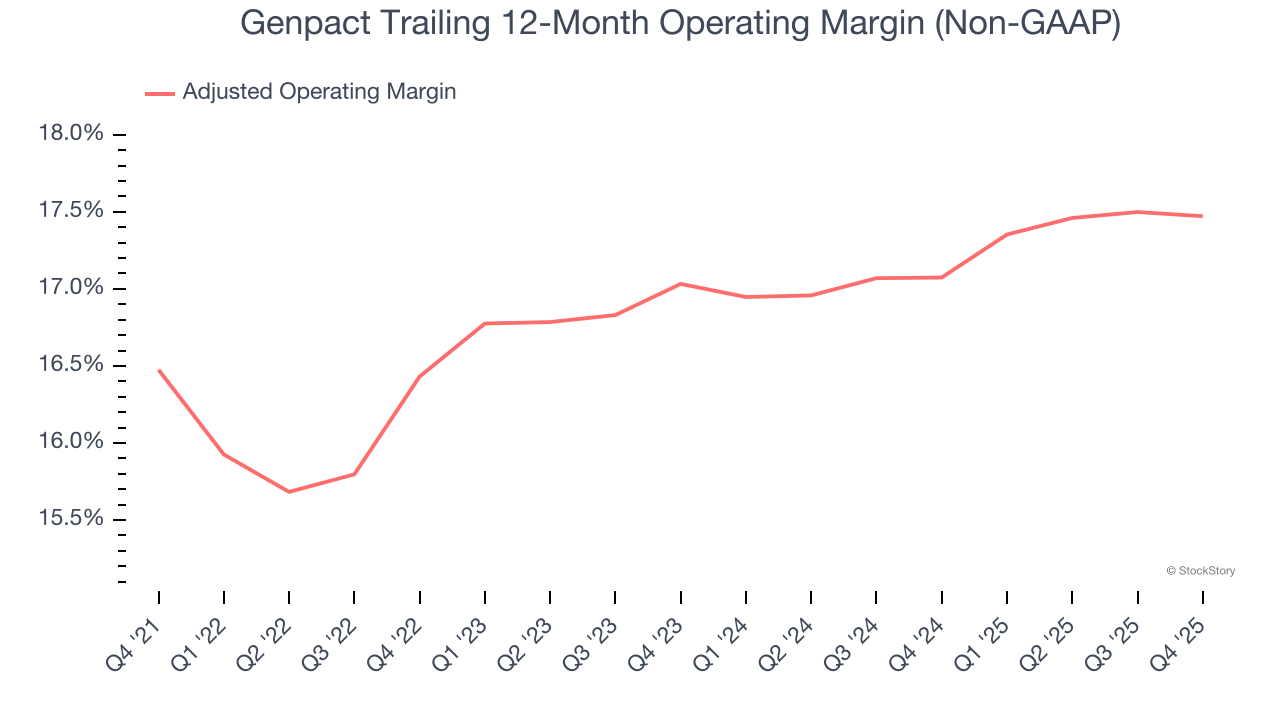
This quarter, Genpact generated an adjusted operating margin profit margin of 17.6%, in line with the same quarter last year. This indicates the company’s overall cost structure has been relatively stable.
Earnings Per Share
Revenue trends explain a company’s historical growth, but the long-term change in earnings per share (EPS) points to the profitability of that growth – for example, a company could inflate its sales through excessive spending on advertising and promotions.
Genpact’s EPS grew at a remarkable 11.5% compounded annual growth rate over the last five years, higher than its 6.5% annualized revenue growth. This tells us the company became more profitable on a per-share basis as it expanded.
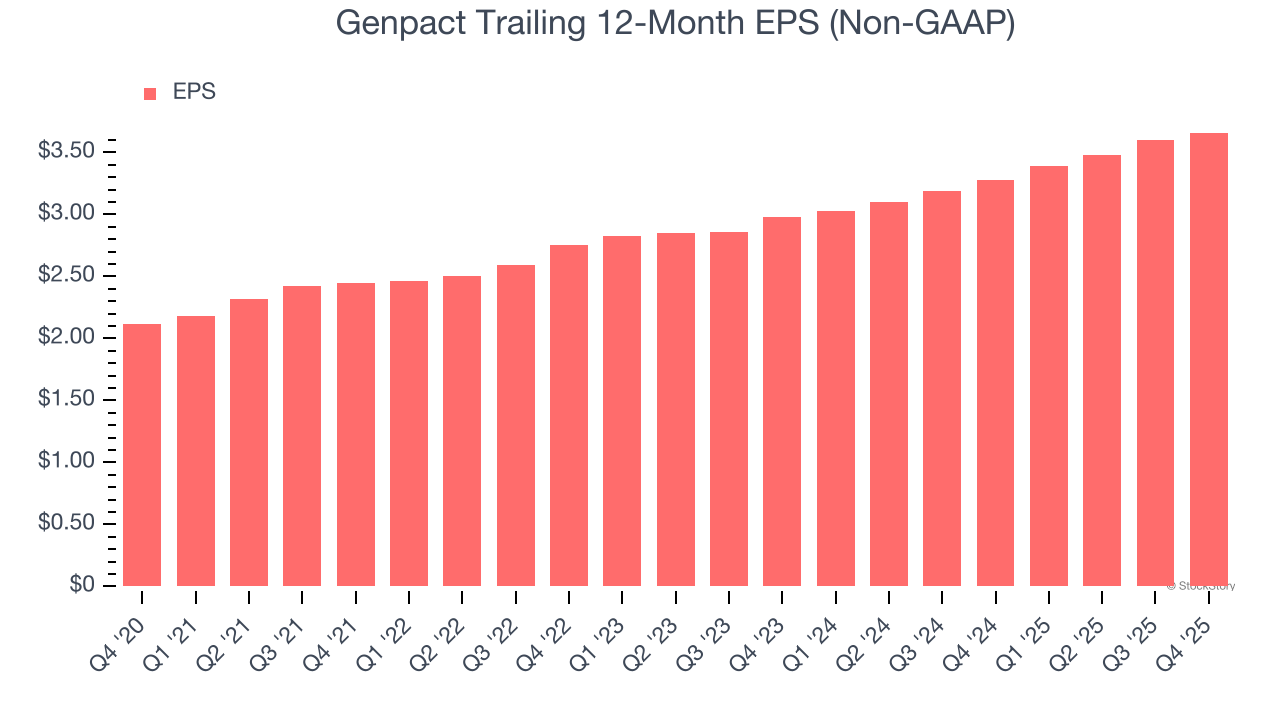
Like with revenue, we analyze EPS over a more recent period because it can provide insight into an emerging theme or development for the business.
For Genpact, its two-year annual EPS growth of 10.8% is similar to its five-year trend, implying stable earnings power.
In Q4, Genpact reported adjusted EPS of $0.97, up from $0.91 in the same quarter last year. This print beat analysts’ estimates by 3.8%. Over the next 12 months, Wall Street expects Genpact’s full-year EPS of $3.66 to grow 7.9%.
Key Takeaways from Genpact’s Q4 Results
It was good to see Genpact beat analysts’ EPS expectations this quarter. We were also happy its EPS guidance for next quarter narrowly outperformed Wall Street’s estimates. On the other hand, its revenue guidance for next quarter slightly missed. Zooming out, we think this was a mixed quarter. The stock remained flat at $38.00 immediately after reporting.
Should you buy the stock or not? The latest quarter does matter, but not nearly as much as longer-term fundamentals and valuation, when deciding if the stock is a buy. We cover that in our actionable full research report which you can read here (it’s free).


