Agricultural and farm machinery company Titan (NSYE:TWI) announced better-than-expected revenue in Q4 CY2025, with sales up 7% year on year to $410.4 million. Guidance for next quarter’s revenue was better than expected at $500 million at the midpoint, 1.7% above analysts’ estimates. Its non-GAAP loss of $0.27 per share was in line with analysts’ consensus estimates.
Is now the time to buy Titan International? Find out by accessing our full research report, it’s free.
Titan International (TWI) Q4 CY2025 Highlights:
- Revenue: $410.4 million vs analyst estimates of $396.9 million (7% year-on-year growth, 3.4% beat)
- Adjusted EPS: -$0.27 vs analyst estimates of -$0.28 (in line)
- Adjusted EBITDA: $10.76 million vs analyst estimates of $9.97 million (2.6% margin, 7.9% beat)
- Revenue Guidance for Q1 CY2026 is $500 million at the midpoint, above analyst estimates of $491.5 million
- EBITDA guidance for the upcoming financial year 2026 is $110 million at the midpoint, below analyst estimates of $114.8 million
- Operating Margin: -2.7%, up from -7.4% in the same quarter last year
- Free Cash Flow was -$5.08 million compared to -$4.57 million in the same quarter last year
- Market Capitalization: $672.1 million
Company Overview
Acquiring Goodyear’s farm tire business in 2005, Titan (NSYE:TWI) is a manufacturer and supplier of wheels, tires, and undercarriages used in off-highway vehicles such as construction vehicles.
Revenue Growth
A company’s long-term sales performance can indicate its overall quality. Any business can put up a good quarter or two, but the best consistently grow over the long haul. Thankfully, Titan International’s 7.7% annualized revenue growth over the last five years was decent. Its growth was slightly above the average industrials company and shows its offerings resonate with customers.
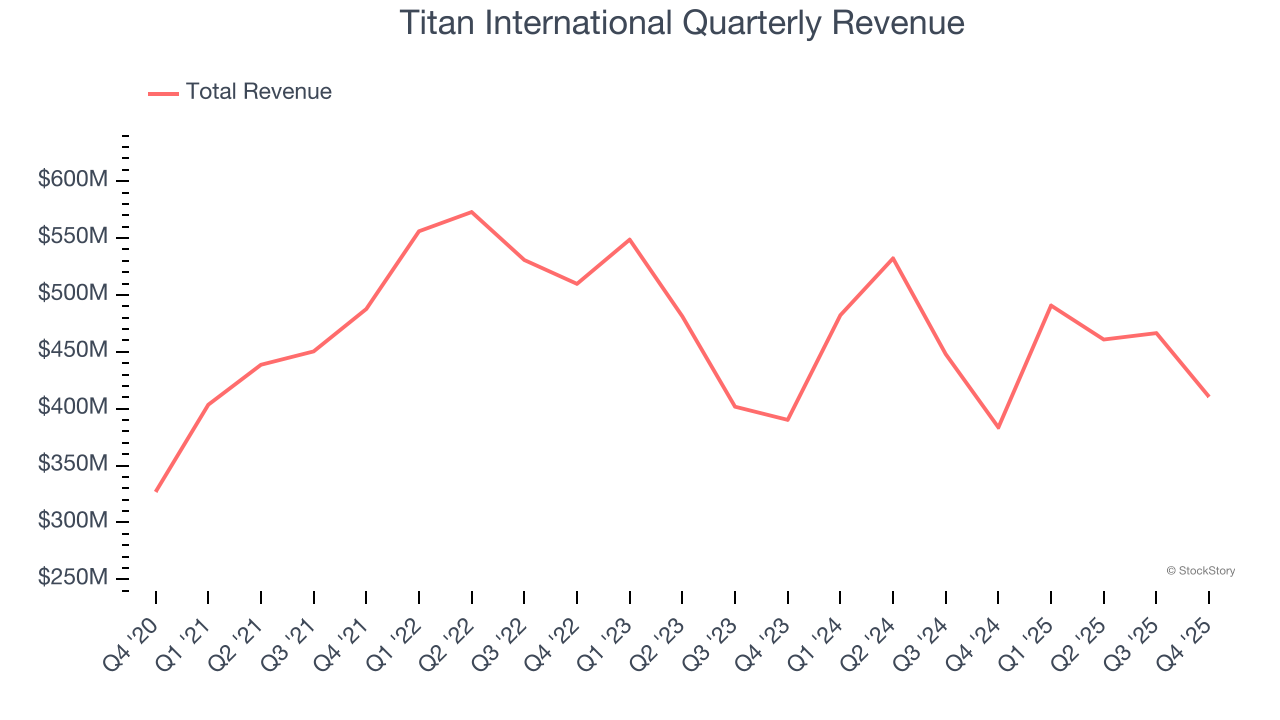
We at StockStory place the most emphasis on long-term growth, but within industrials, a half-decade historical view may miss cycles, industry trends, or a company capitalizing on catalysts such as a new contract win or a successful product line. Titan International’s recent performance shows its demand has slowed as its revenue was flat over the last two years. 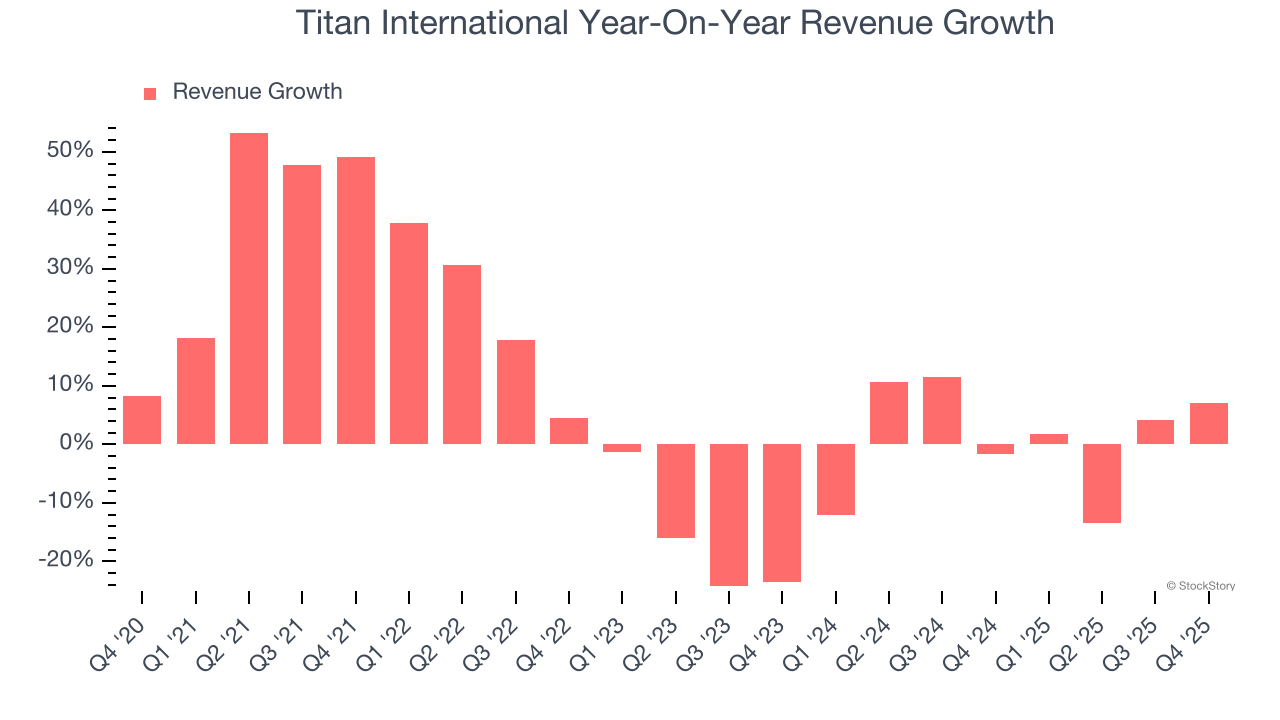
This quarter, Titan International reported year-on-year revenue growth of 7%, and its $410.4 million of revenue exceeded Wall Street’s estimates by 3.4%. Company management is currently guiding for a 1.9% year-on-year increase in sales next quarter.
Looking further ahead, sell-side analysts expect revenue to grow 1.9% over the next 12 months. Although this projection suggests its newer products and services will fuel better top-line performance, it is still below average for the sector.
Microsoft, Alphabet, Coca-Cola, Monster Beverage—all began as under-the-radar growth stories riding a massive trend. We’ve identified the next one: a profitable AI semiconductor play Wall Street is still overlooking. Go here for access to our full report.
Operating Margin
Titan International was profitable over the last five years but held back by its large cost base. Its average operating margin of 5.2% was weak for an industrials business. This result isn’t too surprising given its low gross margin as a starting point.
Analyzing the trend in its profitability, Titan International’s operating margin decreased by 3.6 percentage points over the last five years. This raises questions about the company’s expense base because its revenue growth should have given it leverage on its fixed costs, resulting in better economies of scale and profitability. Titan International’s performance was poor no matter how you look at it - it shows that costs were rising and it couldn’t pass them onto its customers.
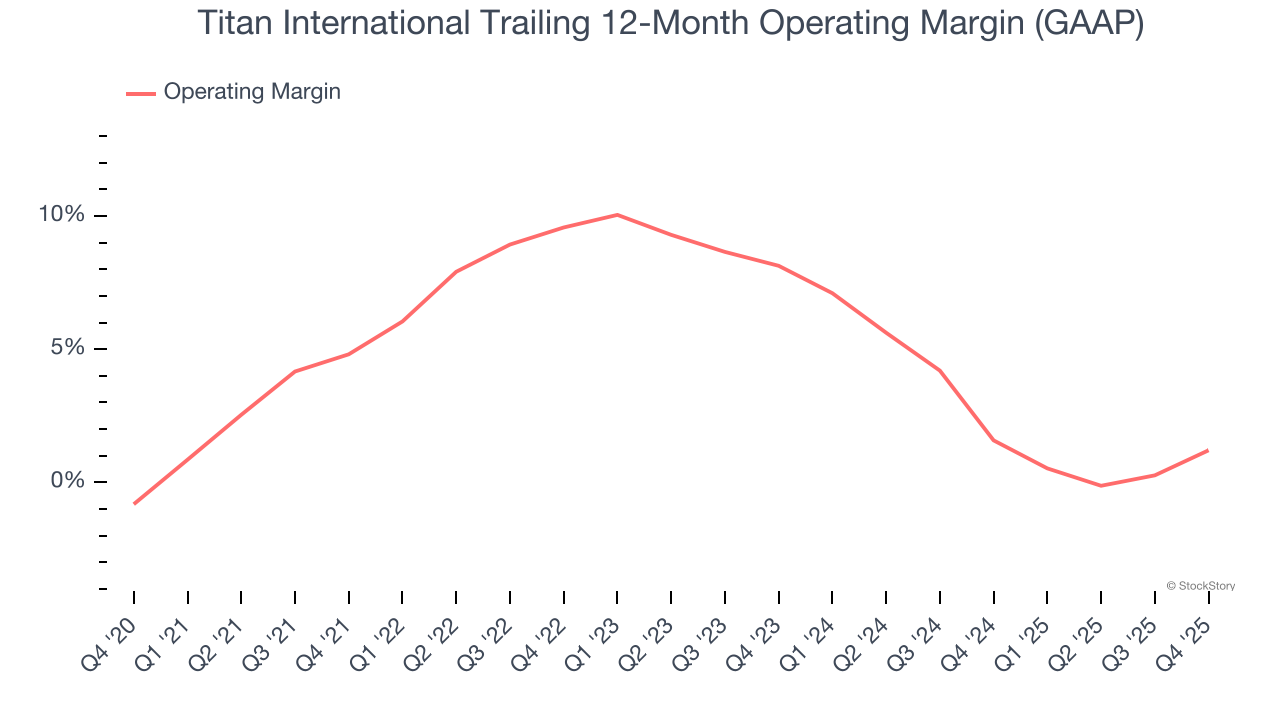
In Q4, Titan International generated an operating margin profit margin of negative 2.7%, up 4.7 percentage points year on year. The increase was encouraging, and because its operating margin rose more than its gross margin, we can infer it was more efficient with expenses such as marketing, R&D, and administrative overhead.
Earnings Per Share
We track the long-term change in earnings per share (EPS) for the same reason as long-term revenue growth. Compared to revenue, however, EPS highlights whether a company’s growth is profitable.
Although Titan International’s full-year earnings are still negative, it reduced its losses and improved its EPS by 15.3% annually over the last five years. The next few quarters will be critical for assessing its long-term profitability.
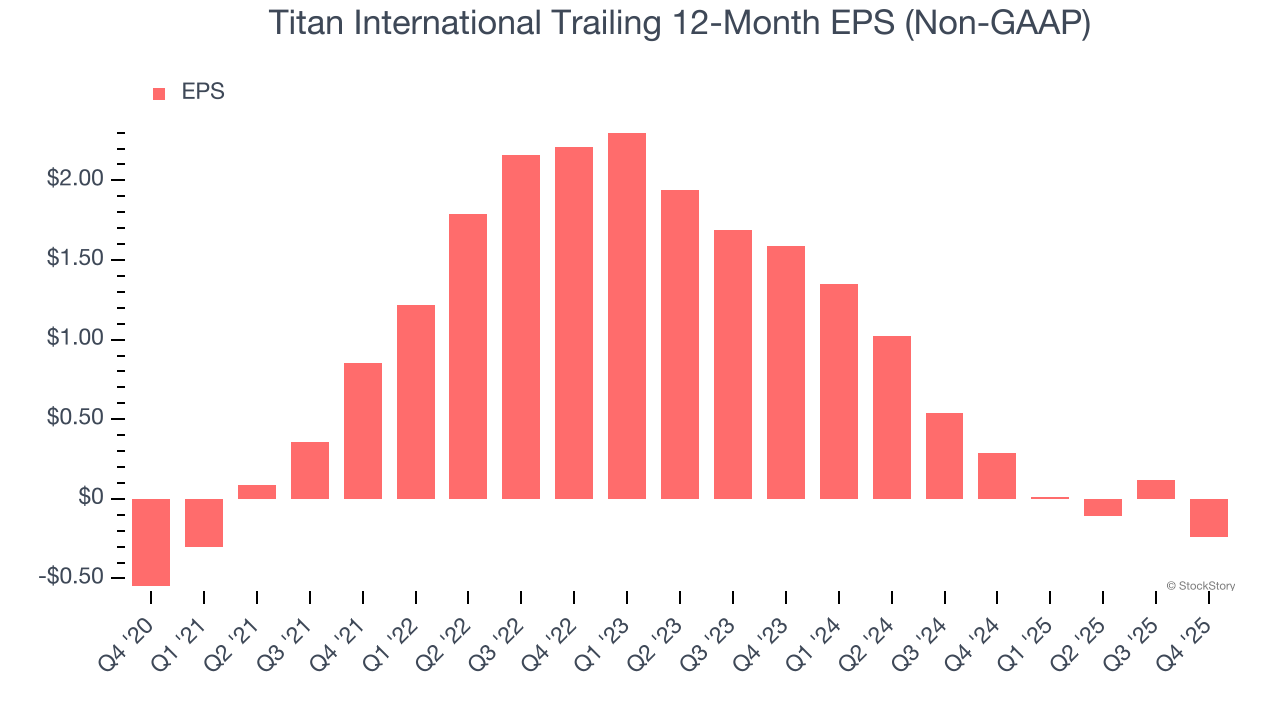
Like with revenue, we analyze EPS over a shorter period to see if we are missing a change in the business.
Sadly for Titan International, its EPS declined by 46.7% annually over the last two years while its revenue was flat. This tells us the company struggled to adjust to choppy demand.
We can take a deeper look into Titan International’s earnings to better understand the drivers of its performance. We mentioned earlier that Titan International’s operating margin expanded this quarter, but a two-year view shows its margin has declinedwhile its share count has grown 3%. This means the company not only became less efficient with its operating expenses but also diluted its shareholders. 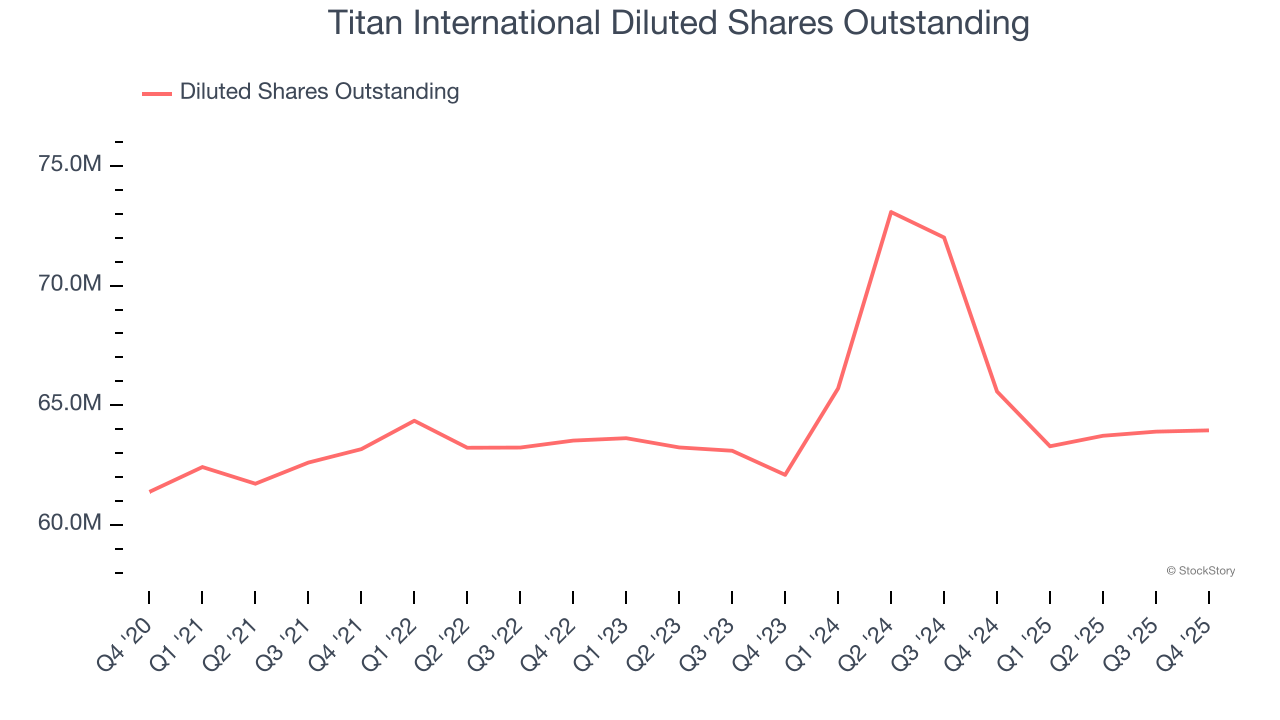
In Q4, Titan International reported adjusted EPS of negative $0.27, down from $0.09 in the same quarter last year. Despite falling year on year, this print beat analysts’ estimates by 1.8%. Over the next 12 months, Wall Street is optimistic. Analysts forecast Titan International’s full-year EPS of negative $0.24 will flip to positive $0.17.
Key Takeaways from Titan International’s Q4 Results
We were impressed by how significantly Titan International blew past analysts’ EBITDA expectations this quarter. We were also glad its revenue outperformed Wall Street’s estimates. On the other hand, its full-year EBITDA guidance missed and its EBITDA guidance for next quarter fell short of Wall Street’s estimates. Overall, we think this was still a decent quarter with some key metrics above expectations. The stock remained flat at $10.51 immediately following the results.
Should you buy the stock or not? If you’re making that decision, you should consider the bigger picture of valuation, business qualities, as well as the latest earnings. We cover that in our actionable full research report which you can read here (it’s free).