
Pool equipment and automation systems manufacturer Hayward Holdings (NYSE: HAYW) reported Q4 CY2025 results topping the market’s revenue expectations, with sales up 6.8% year on year to $349.4 million. Its non-GAAP profit of $0.29 per share was in line with analysts’ consensus estimates.
Is now the time to buy Hayward? Find out by accessing our full research report, it’s free.
Hayward (HAYW) Q4 CY2025 Highlights:
- Revenue: $349.4 million vs analyst estimates of $332.7 million (6.8% year-on-year growth, 5% beat)
- Adjusted EPS: $0.29 vs analyst estimates of $0.28 (in line)
- Adjusted EBITDA: $102.9 million vs analyst estimates of $99.44 million (29.4% margin, 3.5% beat)
- Adjusted EPS guidance for the upcoming financial year 2026 is $0.84 at the midpoint, missing analyst estimates by 0.7%
- Operating Margin: 25%, up from 23.4% in the same quarter last year
- Free Cash Flow was -$34.26 million compared to -$70.43 million in the same quarter last year
- Market Capitalization: $3.40 billion
Company Overview
Credited with introducing the first variable-speed pool pump, Hayward (NYSE: HAYW) makes residential and commercial pool equipment and accessories.
Revenue Growth
A company’s long-term sales performance is one signal of its overall quality. Any business can experience short-term success, but top-performing ones enjoy sustained growth for years. Unfortunately, Hayward’s 5.1% annualized revenue growth over the last five years was tepid. This fell short of our benchmark for the industrials sector and is a rough starting point for our analysis.
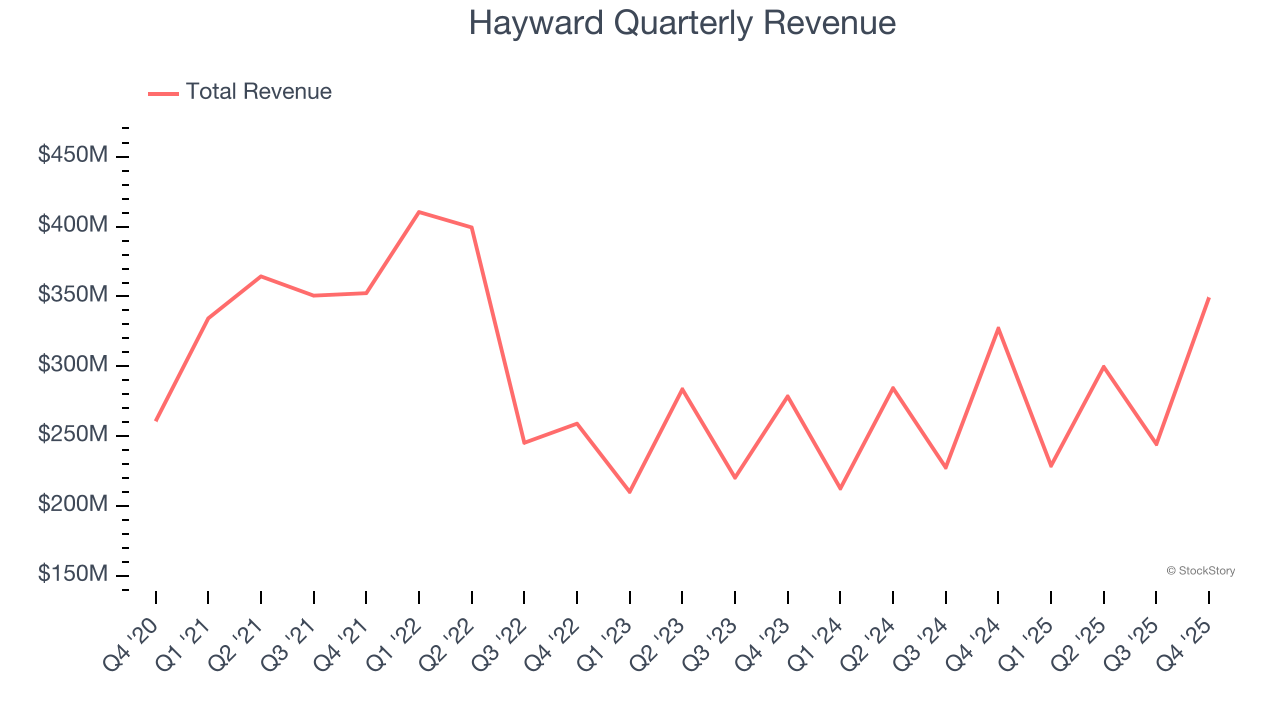
Long-term growth is the most important, but within industrials, a half-decade historical view may miss new industry trends or demand cycles. Hayward’s annualized revenue growth of 6.3% over the last two years is above its five-year trend, which is encouraging. 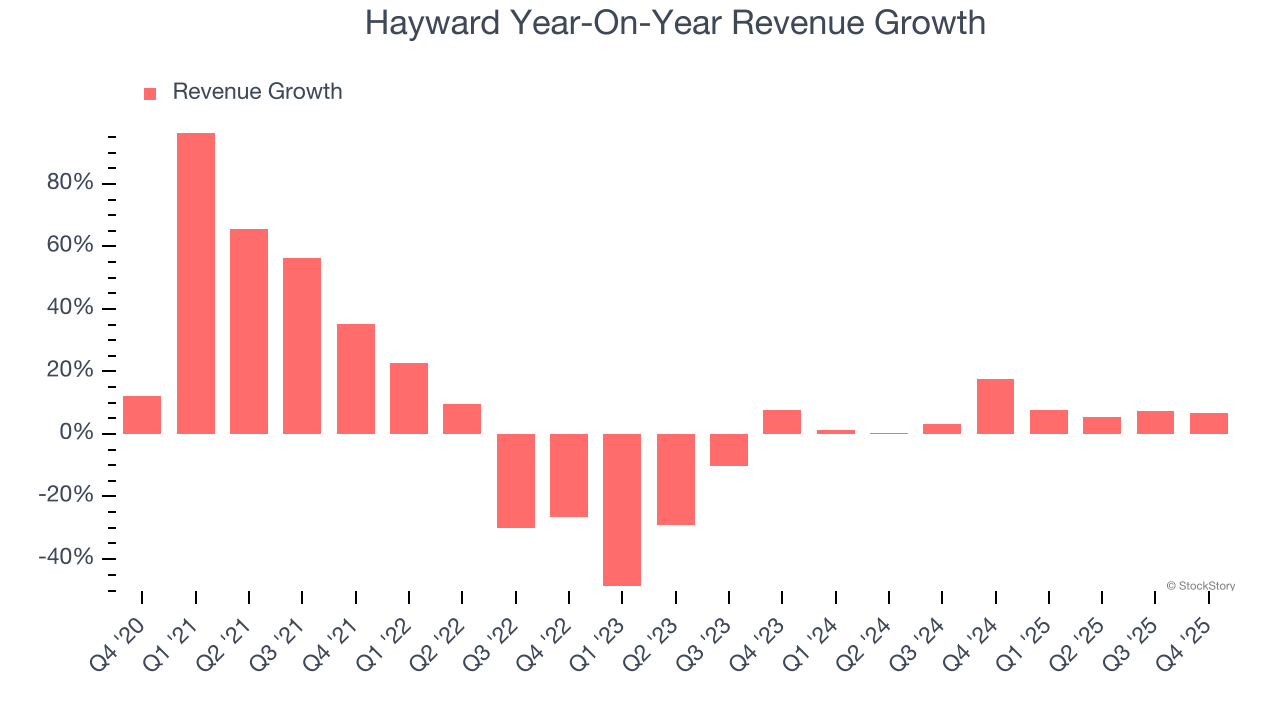
This quarter, Hayward reported year-on-year revenue growth of 6.8%, and its $349.4 million of revenue exceeded Wall Street’s estimates by 5%.
Looking ahead, sell-side analysts expect revenue to grow 3.8% over the next 12 months, a slight deceleration versus the last two years. This projection is underwhelming and implies its products and services will see some demand headwinds.
Software is eating the world and there is virtually no industry left that has been untouched by it. That drives increasing demand for tools helping software developers do their jobs, whether it be monitoring critical cloud infrastructure, integrating audio and video functionality, or ensuring smooth content streaming. Click here to access a free report on our 3 favorite stocks to play this generational megatrend.
Operating Margin
Operating margin is an important measure of profitability as it shows the portion of revenue left after accounting for all core expenses – everything from the cost of goods sold to advertising and wages. It’s also useful for comparing profitability across companies with different levels of debt and tax rates because it excludes interest and taxes.
Hayward has been a well-oiled machine over the last five years. It demonstrated elite profitability for an industrials business, boasting an average operating margin of 20.8%. This result isn’t surprising as its high gross margin gives it a favorable starting point.
Analyzing the trend in its profitability, Hayward’s operating margin decreased by 1.9 percentage points over the last five years. This raises questions about the company’s expense base because its revenue growth should have given it leverage on its fixed costs, resulting in better economies of scale and profitability.
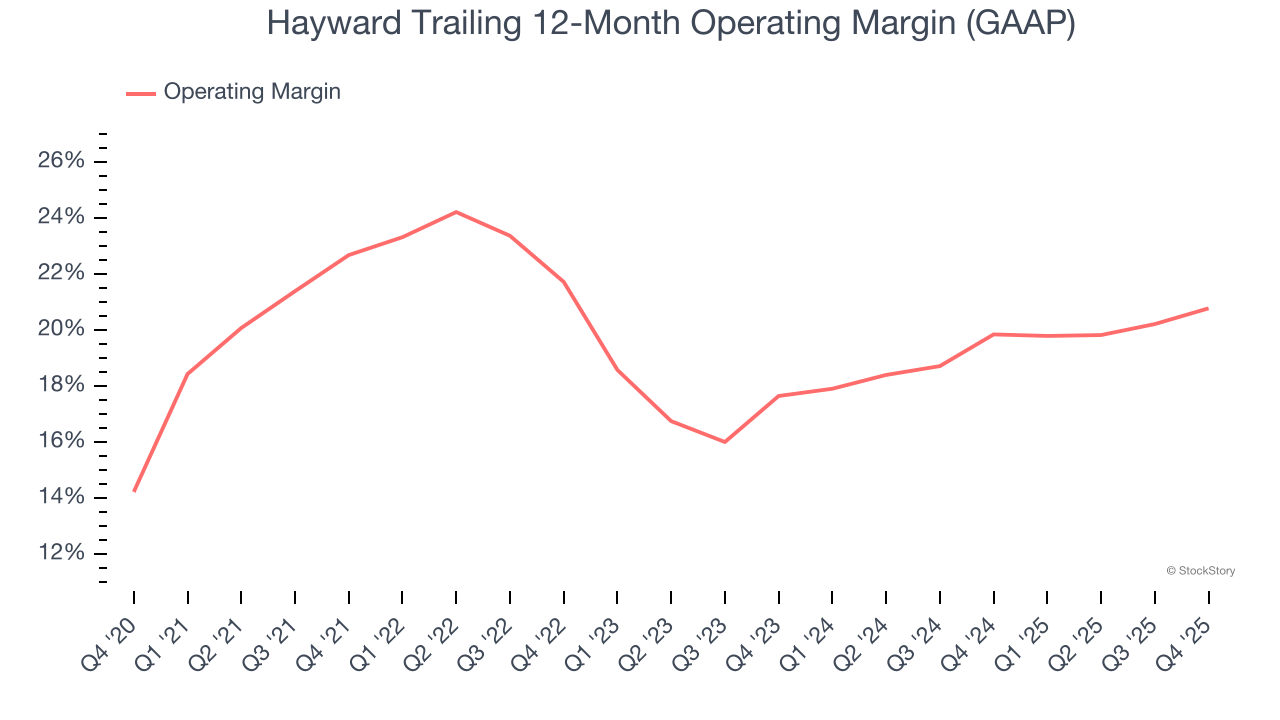
This quarter, Hayward generated an operating margin profit margin of 25%, up 1.6 percentage points year on year. The increase was encouraging, and because its gross margin actually decreased, we can assume it was more efficient because its operating expenses like marketing, R&D, and administrative overhead grew slower than its revenue.
Earnings Per Share
Revenue trends explain a company’s historical growth, but the long-term change in earnings per share (EPS) points to the profitability of that growth – for example, a company could inflate its sales through excessive spending on advertising and promotions.
Hayward’s full-year EPS dropped 113%, or 20.8% annually, over the last four years. We’ll keep a close eye on the company as diminishing earnings could imply changing secular trends and preferences.
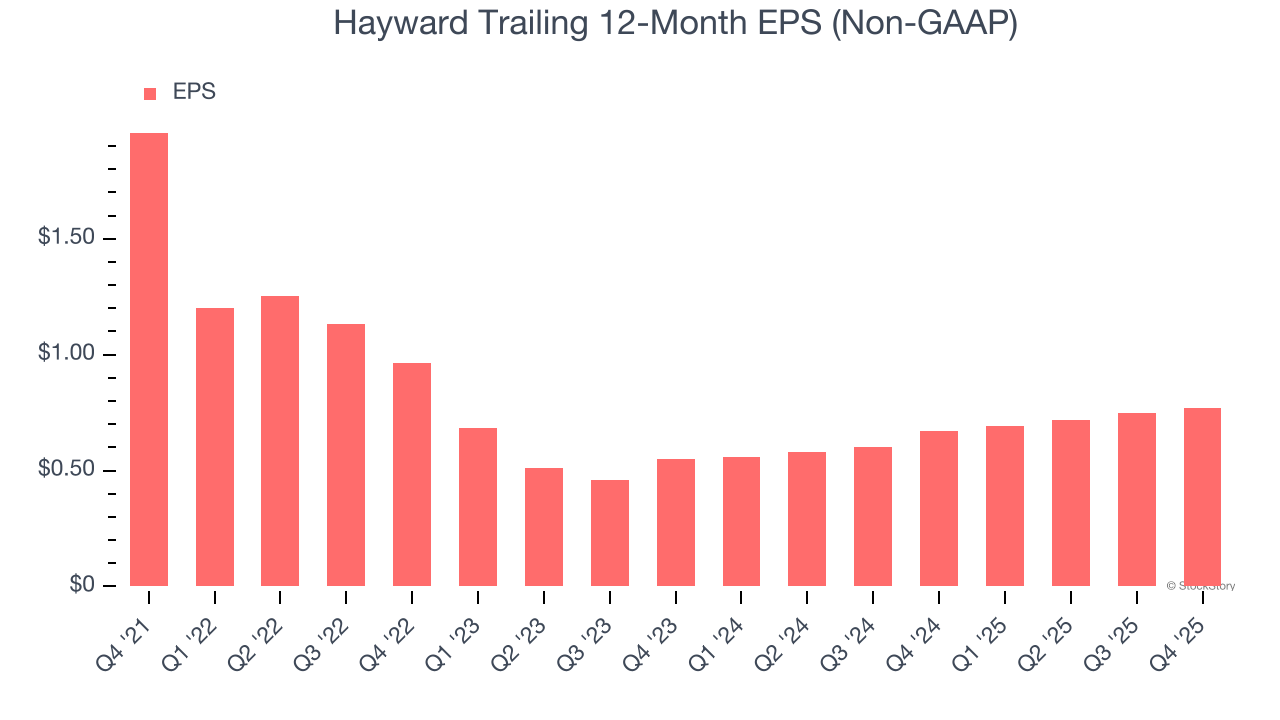
Like with revenue, we analyze EPS over a more recent period because it can provide insight into an emerging theme or development for the business.
Hayward’s EPS grew at an astounding 18.3% compounded annual growth rate over the last two years, higher than its 6.3% annualized revenue growth. This tells us the company became more profitable on a per-share basis as it expanded.
Diving into Hayward’s quality of earnings can give us a better understanding of its performance. Hayward’s operating margin has expanded over the last two years. This was the most relevant factor (aside from the revenue impact) behind its higher earnings; interest expenses and taxes can also affect EPS but don’t tell us as much about a company’s fundamentals.
In Q4, Hayward reported adjusted EPS of $0.29, up from $0.27 in the same quarter last year. This print beat analysts’ estimates by 3.1%. Over the next 12 months, Wall Street expects Hayward’s full-year EPS of $0.77 to grow 10.7%.
Key Takeaways from Hayward’s Q4 Results
We were impressed by how significantly Hayward blew past analysts’ revenue expectations this quarter. We were also happy its EBITDA outperformed Wall Street’s estimates. On the other hand, its full-year EPS guidance slightly missed. Overall, we think this was a solid quarter with some key areas of upside. The stock remained flat at $15.67 immediately following the results.
Should you buy the stock or not? We think that the latest quarter is only one piece of the longer-term business quality puzzle. Quality, when combined with valuation, can help determine if the stock is a buy. We cover that in our actionable full research report which you can read here (it’s free).