American restaurant chain BJ’s Restaurants (NASDAQ: BJRI) reported Q4 CY2025 results exceeding the market’s revenue expectations, with sales up 3.2% year on year to $355.4 million. Its non-GAAP profit of $0.66 per share was 5.7% above analysts’ consensus estimates.
Is now the time to buy BJ's? Find out by accessing our full research report, it’s free.
BJ's (BJRI) Q4 CY2025 Highlights:
- Revenue: $355.4 million vs analyst estimates of $353.4 million (3.2% year-on-year growth, 0.6% beat)
- Adjusted EPS: $0.66 vs analyst estimates of $0.62 (5.7% beat)
- Adjusted EBITDA: $35.55 million vs analyst estimates of $37.12 million (10% margin, 4.2% miss)
- EBITDA guidance for the upcoming financial year 2026 is $145 million at the midpoint, above analyst estimates of $143.3 million
- Operating Margin: 3.1%, up from -1.4% in the same quarter last year
- Locations: 219 at quarter end, up from 218 in the same quarter last year
- Same-Store Sales rose 2.6% year on year (5.5% in the same quarter last year)
- Market Capitalization: $853.4 million
“During the fourth quarter, we continued to deliver on our mission to create a stronger and more consistent BJ’s with our 6th consecutive quarter of comparable restaurant sales and traffic growth along with our 5th consecutive quarter of restaurant level operating profit margin expansion,” commented Lyle Tick, Chief Executive Officer and President.
Company Overview
Founded in 1978 in California, BJ’s Restaurants (NASDAQ: BJRI) is a chain of restaurants whose menu features classic American dishes, often with a twist.
Revenue Growth
Reviewing a company’s long-term sales performance reveals insights into its quality. Any business can put up a good quarter or two, but the best consistently grow over the long haul.
With $1.40 billion in revenue over the past 12 months, BJ's is a mid-sized restaurant chain, which sometimes brings disadvantages compared to larger competitors benefiting from better brand awareness and economies of scale.
As you can see below, BJ’s sales grew at a sluggish 3.2% compounded annual growth rate over the last six years as its restaurant footprint remained unchanged and it barely increased sales at existing, established dining locations.
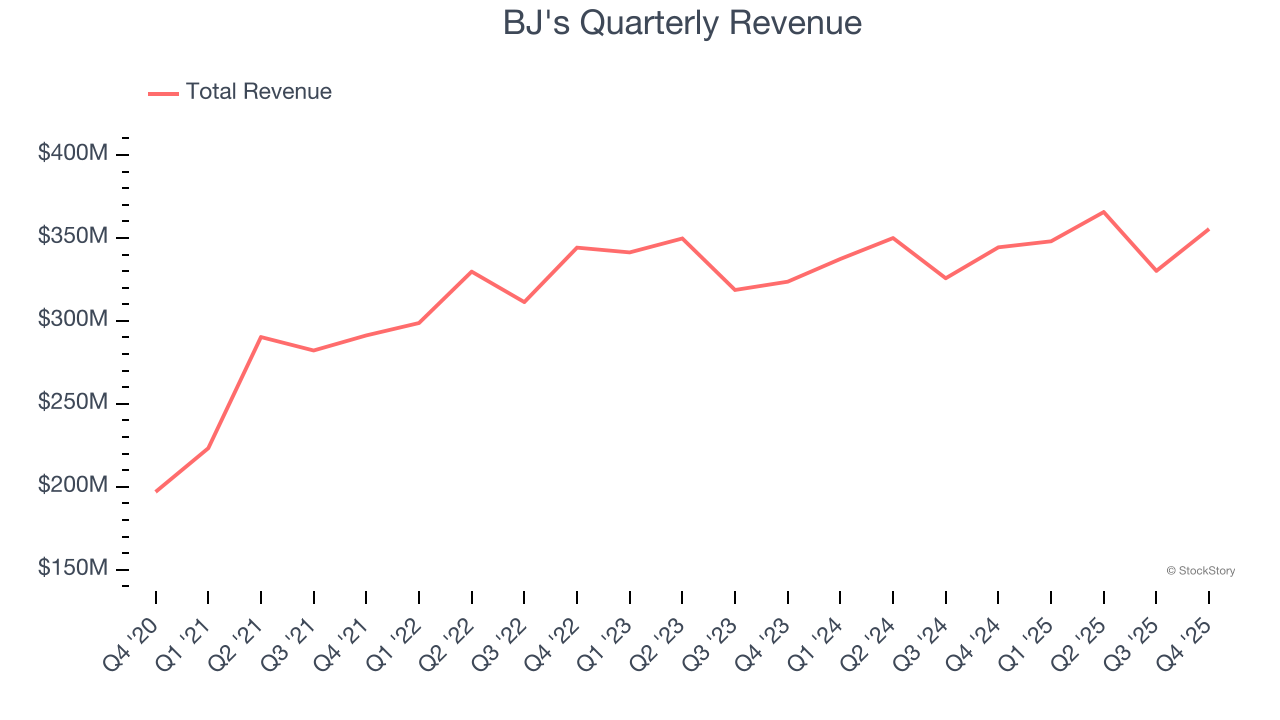
This quarter, BJ's reported modest year-on-year revenue growth of 3.2% but beat Wall Street’s estimates by 0.6%.
Looking ahead, sell-side analysts expect revenue to grow 2.5% over the next 12 months, similar to its six-year rate. This projection doesn't excite us and suggests its newer menu offerings will not lead to better top-line performance yet.
While Wall Street chases Nvidia at all-time highs, an under-the-radar semiconductor supplier is dominating a critical AI component these giants can’t build without. Click here to access our free report one of our favorites growth stories.
Restaurant Performance
Number of Restaurants
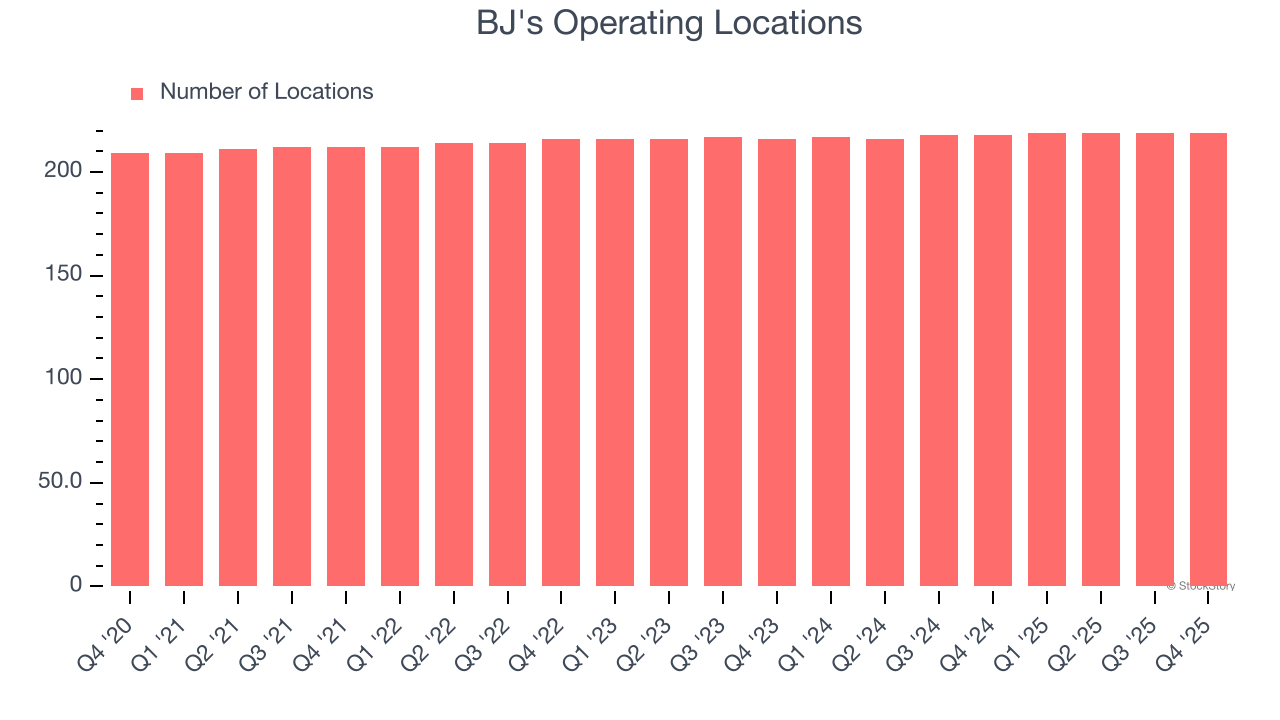
The number of dining locations a restaurant chain operates is a critical driver of how quickly company-level sales can grow.
BJ's listed 219 locations in the latest quarter and has kept its restaurant count flat over the last two years while other restaurant businesses have opted for growth.
When a chain doesn’t open many new restaurants, it usually means there’s stable demand for its meals and it’s focused on improving operational efficiency to increase profitability.
Same-Store Sales
A company's restaurant base only paints one part of the picture. When demand is high, it makes sense to open more. But when demand is low, it’s prudent to close some locations and use the money in other ways. Same-store sales is an industry measure of whether revenue is growing at those existing restaurants and is driven by customer visits (often called traffic) and the average spending per customer (ticket).
BJ’s demand within its existing dining locations has been relatively stable over the last two years but was below most restaurant chains. On average, the company’s same-store sales have grown by 1.6% per year. Given its flat restaurant base over the same period, this performance stems from a mixture of higher prices and increased foot traffic at existing locations.
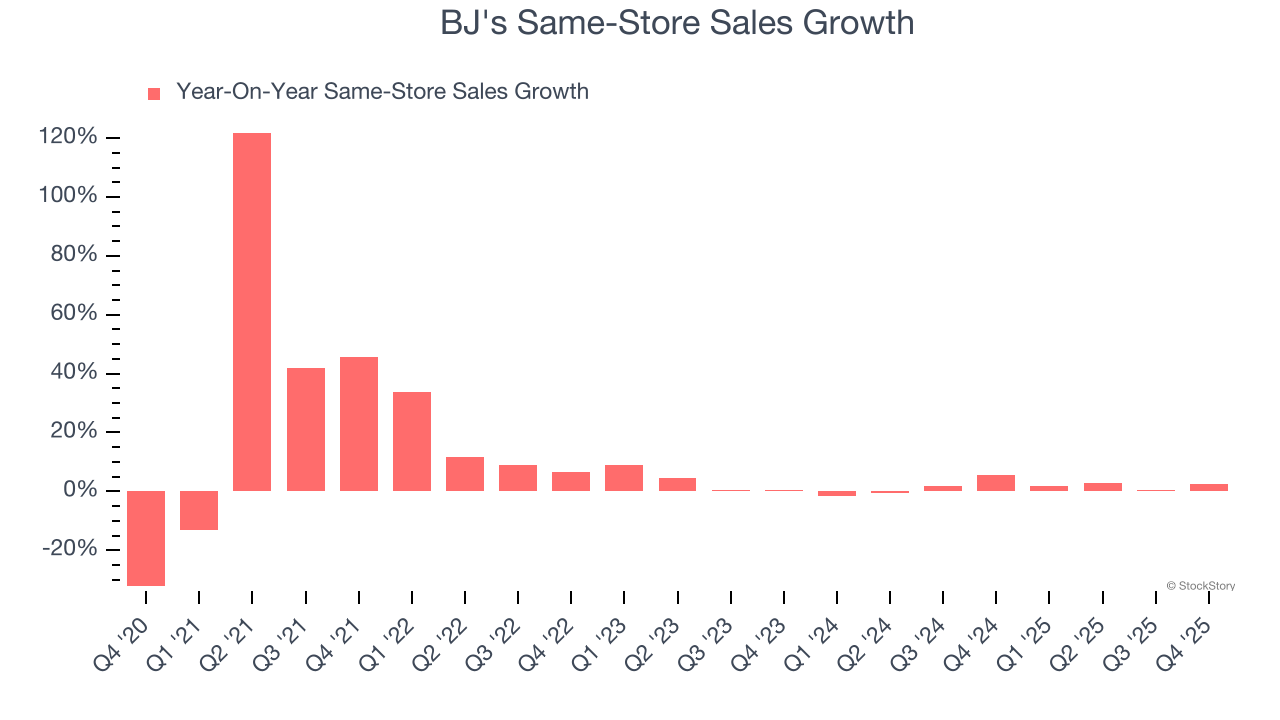
In the latest quarter, BJ’s same-store sales rose 2.6% year on year. This growth was an acceleration from its historical levels, which is always an encouraging sign.
Key Takeaways from BJ’s Q4 Results
It was good to see BJ's meet analysts’ same-store sales expectations this quarter. We were also glad its full-year EBITDA guidance slightly exceeded Wall Street’s estimates. On the other hand, its EBITDA missed. Overall, this quarter could have been better. The stock remained flat at $41.00 immediately after reporting.
Is BJ's an attractive investment opportunity at the current price? What happened in the latest quarter matters, but not as much as longer-term business quality and valuation, when deciding whether to invest in this stock. We cover that in our actionable full research report which you can read here (it’s free).


