
Business management solutions provider Barrett Business Services (NASDAQ: BBSI) missed Wall Street’s revenue expectations in Q4 CY2025, but sales rose 5.3% year on year to $321.1 million. Its GAAP profit of $0.64 per share was in line with analysts’ consensus estimates.
Is now the time to buy Barrett? Find out by accessing our full research report, it’s free.
Barrett (BBSI) Q4 CY2025 Highlights:
- Revenue: $321.1 million vs analyst estimates of $323.4 million (5.3% year-on-year growth, 0.7% miss)
- EPS (GAAP): $0.64 vs analyst estimates of $0.64 (in line)
- Adjusted EBITDA: $20.68 million vs analyst estimates of $24.47 million (6.4% margin, 15.5% miss)
- Operating Margin: 5.8%, in line with the same quarter last year
- Market Capitalization: $795.9 million
“BBSI closed 2025 with another quarter of solid execution, finishing in line with our earnings expectations and delivering one of our strongest years of controllable growth in recent history,” said Gary Kramer, President and CEO of BBSI.
Company Overview
Operating as a professional employer organization (PEO) that serves over 8,000 companies with more than 120,000 worksite employees, Barrett Business Services (NASDAQ: BBSI) provides management solutions that help small and mid-sized businesses handle human resources, payroll, workers' compensation, and other administrative functions.
Revenue Growth
Examining a company’s long-term performance can provide clues about its quality. Even a bad business can shine for one or two quarters, but a top-tier one grows for years.
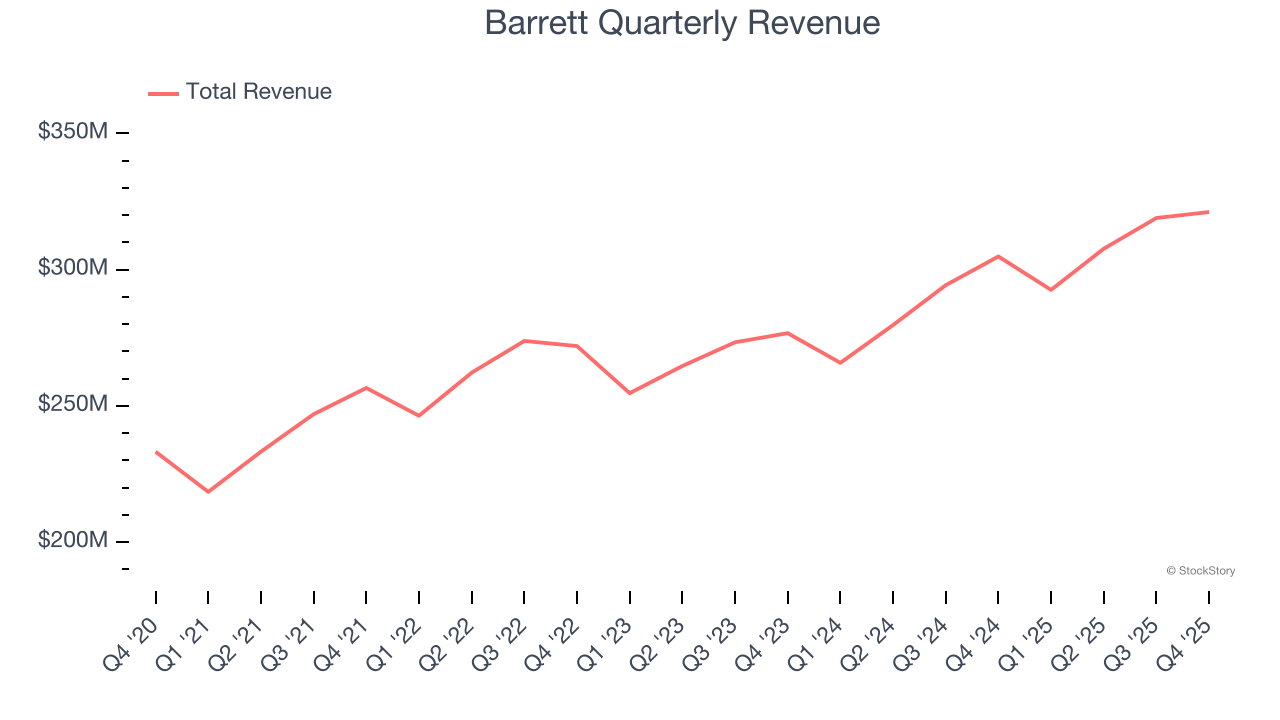
With $1.24 billion in revenue over the past 12 months, Barrett is a mid-sized business services company, which sometimes brings disadvantages compared to larger competitors benefiting from better economies of scale. On the bright side, it can still flex high growth rates because it’s working from a smaller revenue base.
As you can see below, Barrett’s 7.1% annualized revenue growth over the last five years was solid. This is an encouraging starting point for our analysis because it shows Barrett’s demand was higher than many business services companies.
We at StockStory place the most emphasis on long-term growth, but within business services, a half-decade historical view may miss recent innovations or disruptive industry trends. Barrett’s annualized revenue growth of 7.7% over the last two years aligns with its five-year trend, suggesting its demand was predictably strong. 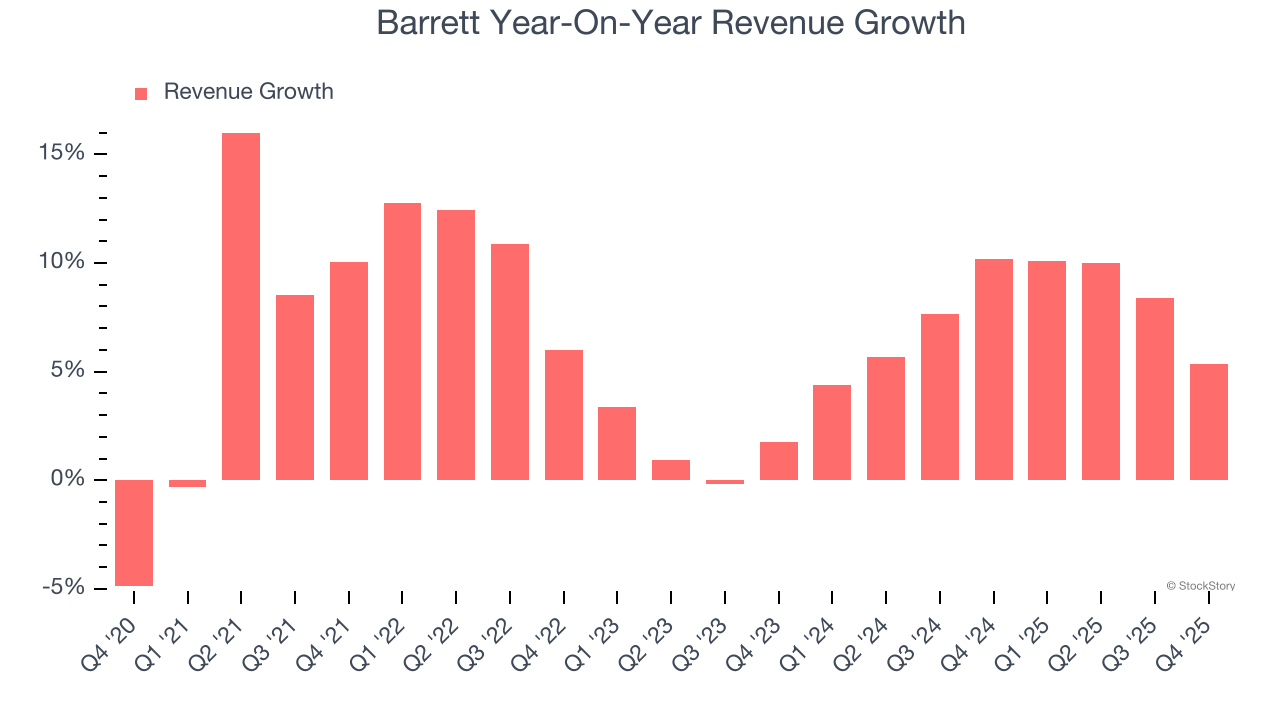
This quarter, Barrett’s revenue grew by 5.3% year on year to $321.1 million, missing Wall Street’s estimates.
Looking ahead, sell-side analysts expect revenue to grow 7.8% over the next 12 months, similar to its two-year rate. This projection is admirable and implies the market sees success for its products and services.
The 1999 book Gorilla Game predicted Microsoft and Apple would dominate tech before it happened. Its thesis? Identify the platform winners early. Today, enterprise software companies embedding generative AI are becoming the new gorillas. a profitable, fast-growing enterprise software stock that is already riding the automation wave and looking to catch the generative AI next.
Operating Margin
Operating margin is a key measure of profitability. Think of it as net income - the bottom line - excluding the impact of taxes and interest on debt, which are less connected to business fundamentals.
Barrett’s operating margin might fluctuated slightly over the last 12 months but has remained more or less the same, averaging 5.2% over the last five years. This profitability was lousy for a business services business and caused by its suboptimal cost structure.
Analyzing the trend in its profitability, Barrett’s operating margin might fluctuated slightly but has generally stayed the same over the last five years. This raises questions about the company’s expense base because its revenue growth should have given it leverage on its fixed costs, resulting in better economies of scale and profitability.
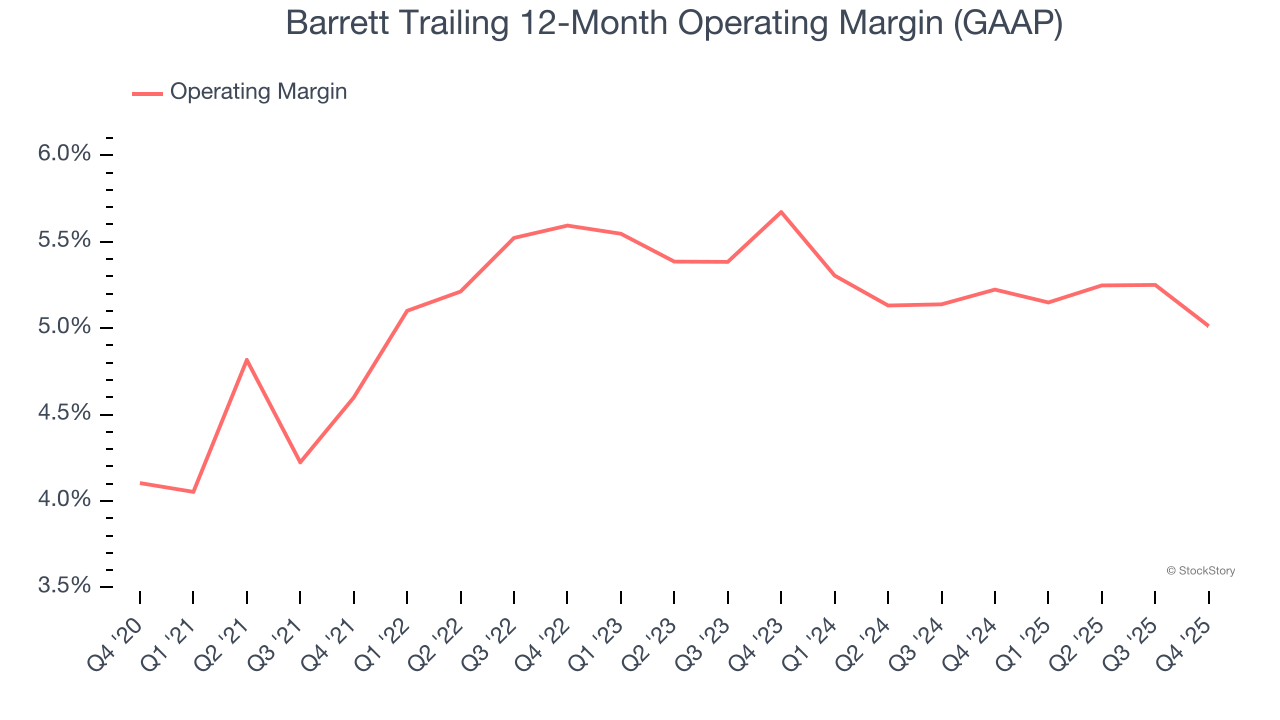
In Q4, Barrett generated an operating margin profit margin of 5.8%, in line with the same quarter last year. This indicates the company’s overall cost structure has been relatively stable.
Earnings Per Share
Revenue trends explain a company’s historical growth, but the long-term change in earnings per share (EPS) points to the profitability of that growth – for example, a company could inflate its sales through excessive spending on advertising and promotions.
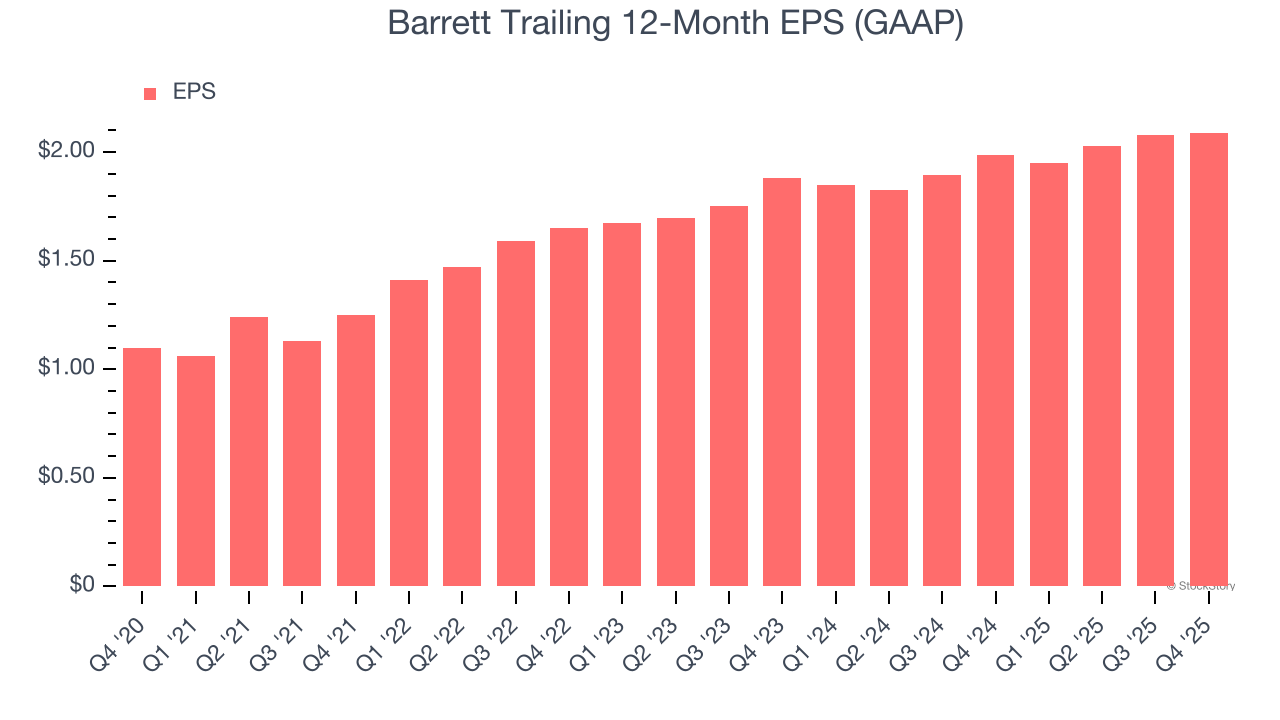
Barrett’s EPS grew at a spectacular 13.7% compounded annual growth rate over the last five years, higher than its 7.1% annualized revenue growth. This tells us the company became more profitable on a per-share basis as it expanded.
Like with revenue, we analyze EPS over a shorter period to see if we are missing a change in the business.
For Barrett, its two-year annual EPS growth of 5.4% was lower than its five-year trend. This wasn’t great, but at least the company was successful in other measures of financial health.
In Q4, Barrett reported EPS of $0.64, up from $0.63 in the same quarter last year. This print was close to analysts’ estimates. Over the next 12 months, Wall Street expects Barrett’s full-year EPS of $2.09 to grow 14.8%.
Key Takeaways from Barrett’s Q4 Results
We struggled to find many positives in these results. Overall, this was a weaker quarter. The stock traded down 4.4% to $30.11 immediately after reporting.
Barrett underperformed this quarter, but does that create an opportunity to invest right now? The latest quarter does matter, but not nearly as much as longer-term fundamentals and valuation, when deciding if the stock is a buy. We cover that in our actionable full research report which you can read here (it’s free).


