
Solar tracking systems manufacturer Array (NASDAQ: ARRY) reported Q4 CY2025 results exceeding the market’s revenue expectations, but sales fell by 17.9% year on year to $226 million. The company expects the full year’s revenue to be around $1.45 billion, close to analysts’ estimates. Its non-GAAP profit of $0.01 per share was in line with analysts’ consensus estimates.
Is now the time to buy Array? Find out by accessing our full research report, it’s free.
Array (ARRY) Q4 CY2025 Highlights:
- Revenue: $226 million vs analyst estimates of $213 million (17.9% year-on-year decline, 6.1% beat)
- Adjusted EPS: $0.01 vs analyst estimates of $0 (in line)
- Adjusted EBITDA: $11.24 million vs analyst estimates of $15.81 million (5% margin, 28.9% miss)
- Adjusted EPS guidance for the upcoming financial year 2026 is $0.70 at the midpoint, missing analyst estimates by 20.8%
- EBITDA guidance for the upcoming financial year 2026 is $215 million at the midpoint, below analyst estimates of $256.4 million
- Operating Margin: -65.5%, down from -51.7% in the same quarter last year
- Free Cash Flow Margin: 16%, down from 20.3% in the same quarter last year
- Market Capitalization: $1.64 billion
Company Overview
Going public in October 2020, Array (NASDAQ: ARRY) is a global manufacturer of ground-mounting tracking systems for utility and distributed generation solar energy projects.
Revenue Growth
A company’s long-term sales performance is one signal of its overall quality. Any business can put up a good quarter or two, but the best consistently grow over the long haul. Luckily, Array’s sales grew at a decent 8% compounded annual growth rate over the last five years. Its growth was slightly above the average industrials company and shows its offerings resonate with customers.
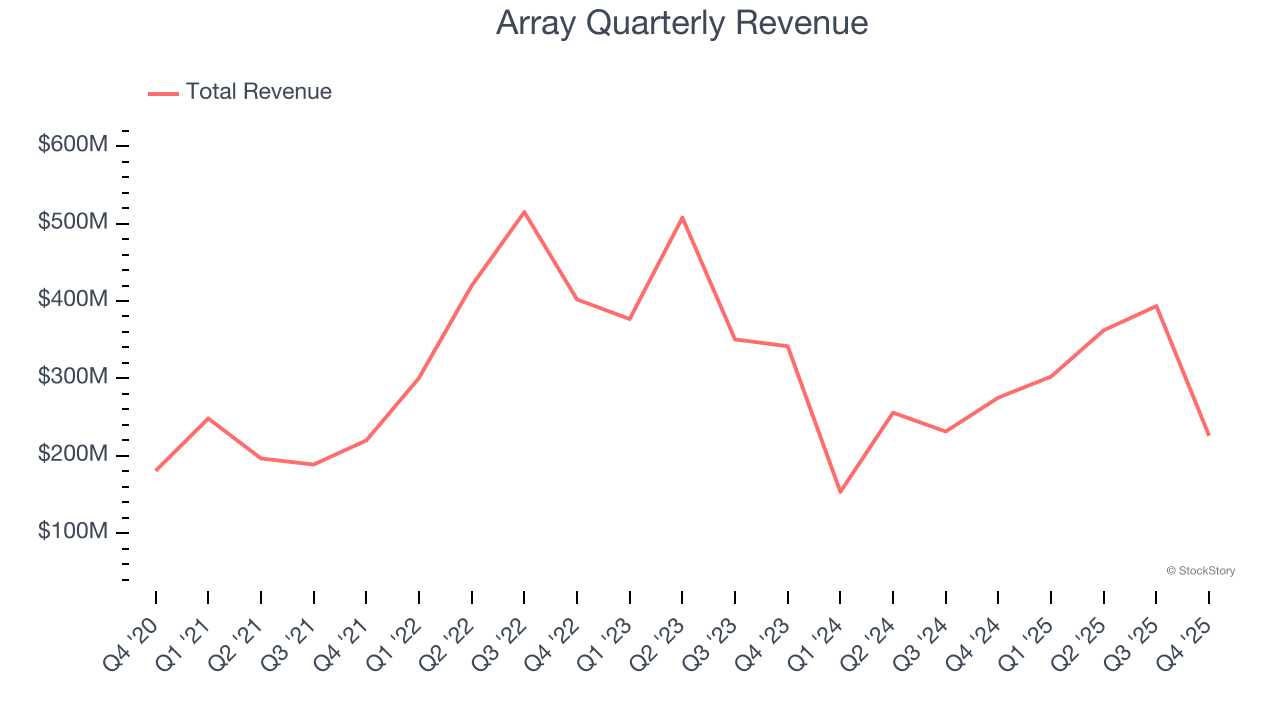
Long-term growth is the most important, but within industrials, a half-decade historical view may miss new industry trends or demand cycles. Array’s recent performance marks a sharp pivot from its five-year trend as its revenue has shown annualized declines of 9.7% over the last two years. 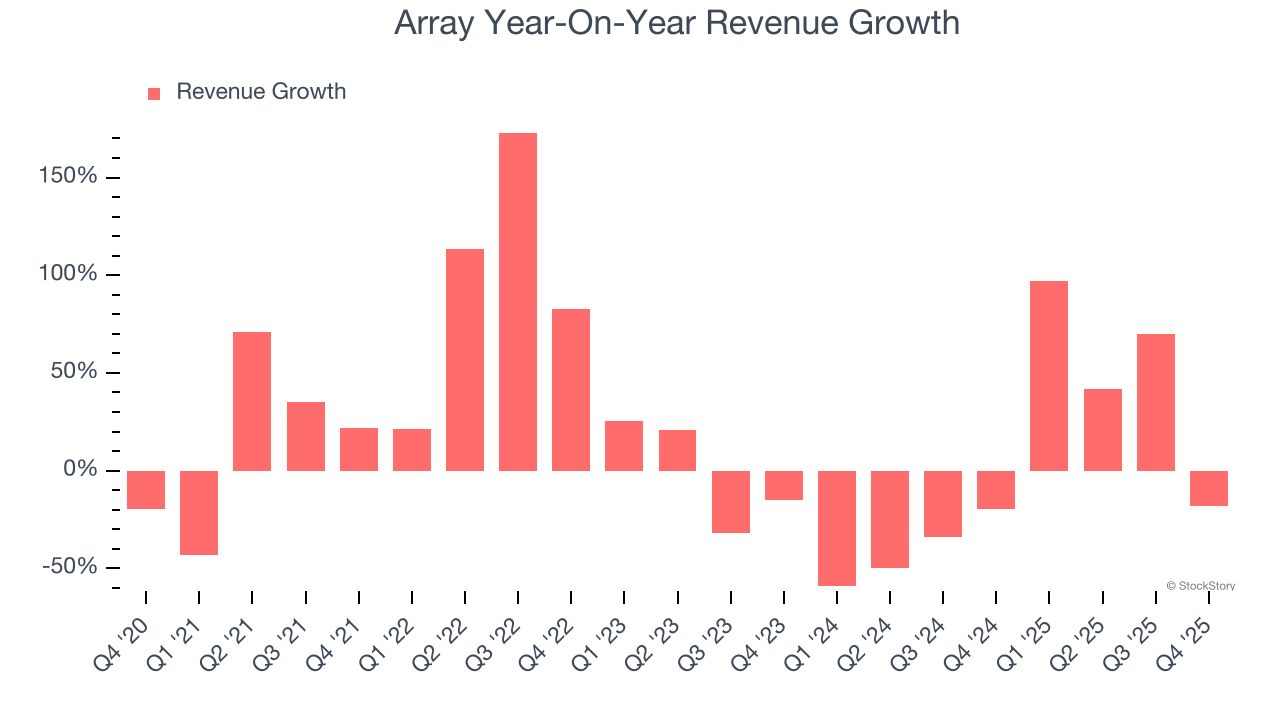
This quarter, Array’s revenue fell by 17.9% year on year to $226 million but beat Wall Street’s estimates by 6.1%.
Looking ahead, sell-side analysts expect revenue to grow 13.2% over the next 12 months, an improvement versus the last two years. This projection is admirable and indicates its newer products and services will fuel better top-line performance.
While Wall Street chases Nvidia at all-time highs, an under-the-radar semiconductor supplier is dominating a critical AI component these giants can’t build without. Click here to access our free report one of our favorites growth stories.
Operating Margin
Array’s operating margin has been trending up over the last 12 months, but it still averaged negative 1% over the last five years. This is due to its large expense base and inefficient cost structure.
Analyzing the trend in its profitability, Array’s operating margin might fluctuated slightly but has generally stayed the same over the last five years. This raises questions about the company’s expense base because its revenue growth should have given it leverage on its fixed costs, resulting in better economies of scale and profitability.
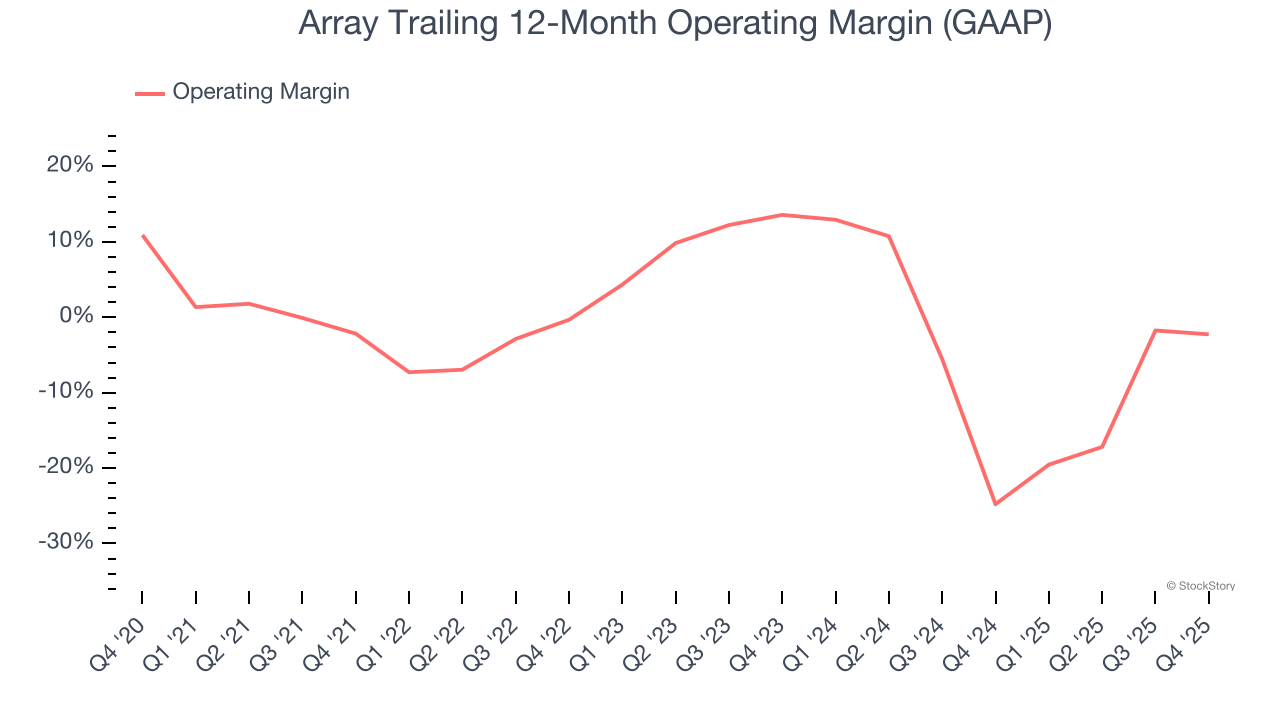
This quarter, Array generated a negative 65.5% operating margin.
Earnings Per Share
Revenue trends explain a company’s historical growth, but the long-term change in earnings per share (EPS) points to the profitability of that growth – for example, a company could inflate its sales through excessive spending on advertising and promotions.
Array’s full-year EPS grew at an astounding 51.8% compounded annual growth rate over the last four years, better than the broader industrials sector.
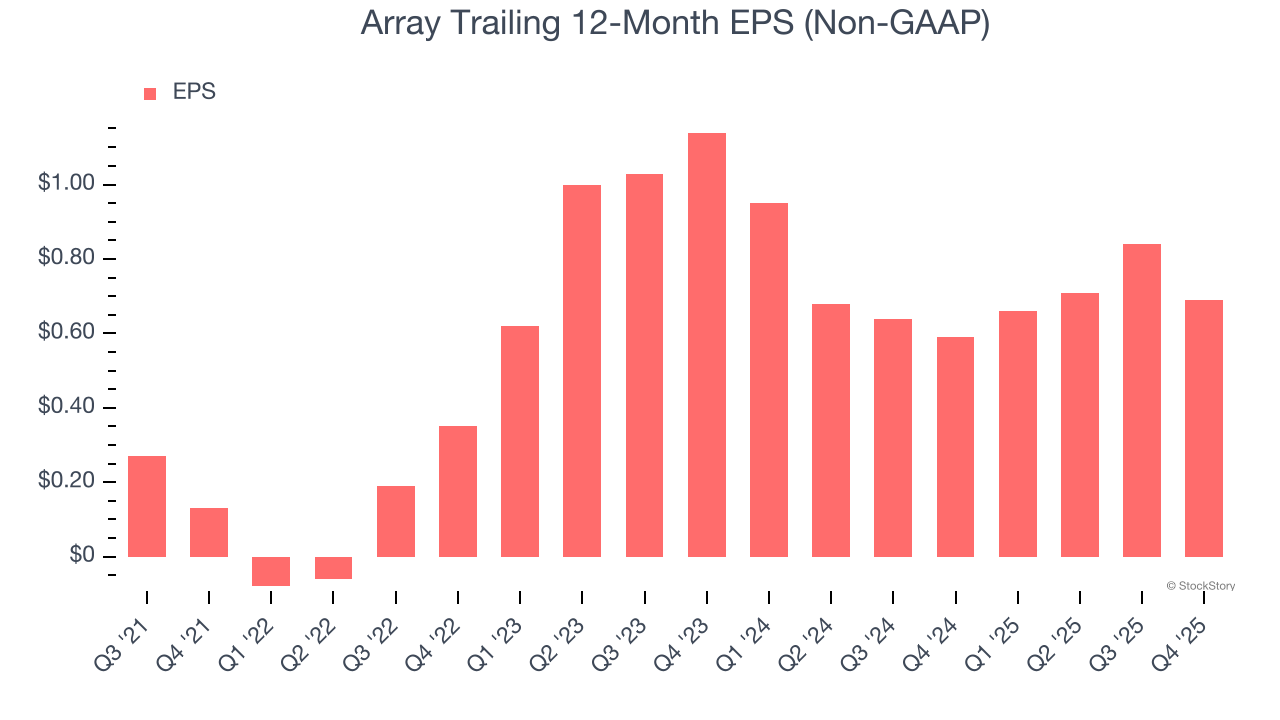
Like with revenue, we analyze EPS over a more recent period because it can provide insight into an emerging theme or development for the business.
Sadly for Array, its EPS declined by more than its revenue over the last two years, dropping 22.2%. This tells us the company struggled to adjust to shrinking demand.
Diving into the nuances of Array’s earnings can give us a better understanding of its performance. Array’s operating margin has declined over the last two years. This was the most relevant factor (aside from the revenue impact) behind its lower earnings; interest expenses and taxes can also affect EPS but don’t tell us as much about a company’s fundamentals.
In Q4, Array reported adjusted EPS of $0.01, down from $0.16 in the same quarter last year. Despite falling year on year, this print easily cleared analysts’ estimates. Over the next 12 months, Wall Street expects Array’s full-year EPS of $0.69 to grow 27.5%.
Key Takeaways from Array’s Q4 Results
It was encouraging to see Array meet analysts’ EPS expectations this quarter. We were also excited its revenue outperformed Wall Street’s estimates by a wide margin. On the other hand, its full-year EBITDA guidance missed and its EBITDA fell short of Wall Street’s estimates. Overall, this was a softer quarter. The stock traded down 23.2% to $8.46 immediately following the results.
Should you buy the stock or not? We think that the latest quarter is only one piece of the longer-term business quality puzzle. Quality, when combined with valuation, can help determine if the stock is a buy. We cover that in our actionable full research report which you can read here (it’s free).


