
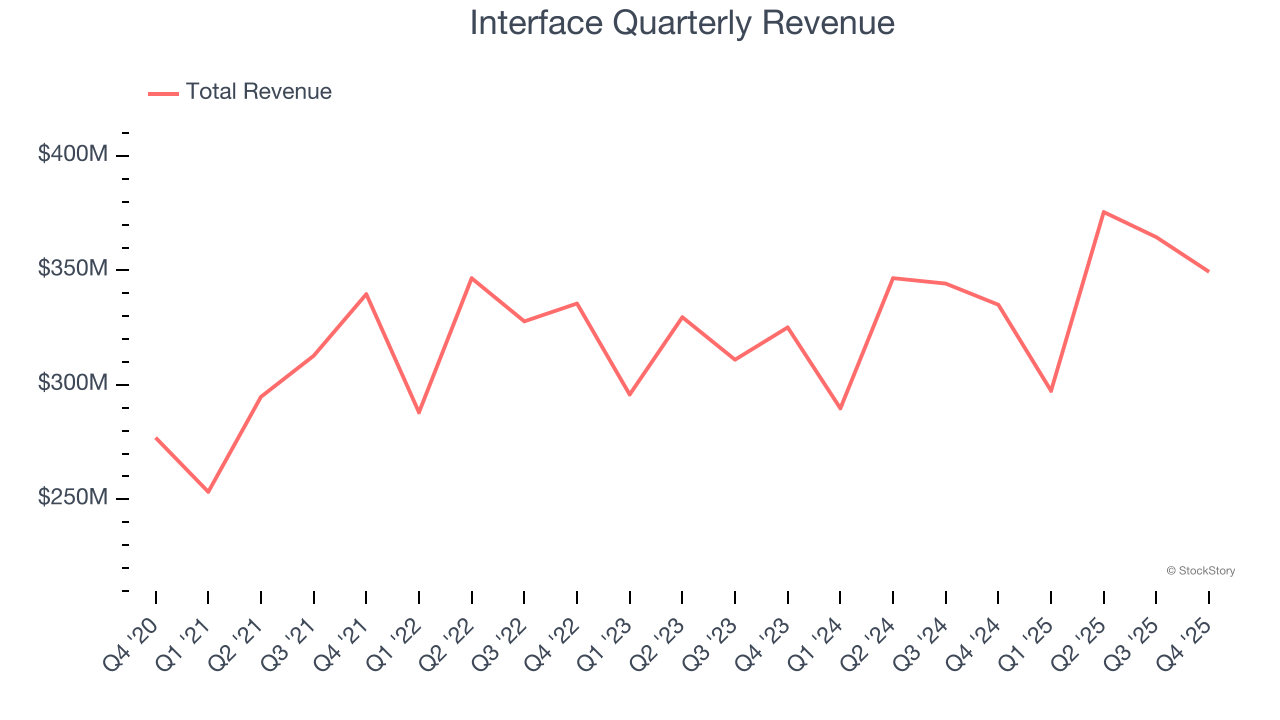
Modular flooring manufacturer Interface (NASDAQ: TILE) met Wall Street’s revenue expectations in Q4 CY2025, with sales up 4.3% year on year to $349.4 million. The company expects next quarter’s revenue to be around $320 million, slightly above analysts’ estimates. Its non-GAAP profit of $0.49 per share was 21.5% above analysts’ consensus estimates.
Is now the time to buy Interface? Find out by accessing our full research report, it’s free.
Interface (TILE) Q4 CY2025 Highlights:
- Revenue: $349.4 million vs analyst estimates of $348.3 million (4.3% year-on-year growth, in line)
- Adjusted EPS: $0.49 vs analyst estimates of $0.40 (21.5% beat)
- Adjusted EBITDA: $49.8 million vs analyst estimates of $49.86 million (14.3% margin, in line)
- Revenue Guidance for Q1 CY2026 is $320 million at the midpoint, above analyst estimates of $314.6 million
- Operating Margin: 10.1%, up from 8.8% in the same quarter last year
- Market Capitalization: $1.84 billion
“We delivered record results in 2025 as our team executed well in a dynamic macro environment. Currency-neutral net sales increased 4% year over year, driven by growth across all regions, all product categories, and key market segments. Adjusted gross profit margin expanded to 39%, reflecting favorable pricing and mix, as well as manufacturing efficiencies,” commented Laurel Hurd, CEO of Interface.
Company Overview
Pioneering carbon-neutral flooring since its founding in 1973, Interface (NASDAQ: TILE) is a global manufacturer of modular carpet tiles, luxury vinyl tile (LVT), and rubber flooring that specializes in carbon-neutral and sustainable flooring solutions.
Revenue Growth
A company’s long-term sales performance is one signal of its overall quality. Even a bad business can shine for one or two quarters, but a top-tier one grows for years.
With $1.39 billion in revenue over the past 12 months, Interface is a mid-sized business services company, which sometimes brings disadvantages compared to larger competitors benefiting from better economies of scale.
As you can see below, Interface grew its sales at a mediocre 4.7% compounded annual growth rate over the last five years. This shows it couldn’t generate demand in any major way and is a tough starting point for our analysis.
Long-term growth is the most important, but within business services, a half-decade historical view may miss new innovations or demand cycles. Interface’s annualized revenue growth of 4.9% over the last two years aligns with its five-year trend, suggesting its demand was consistently weak. 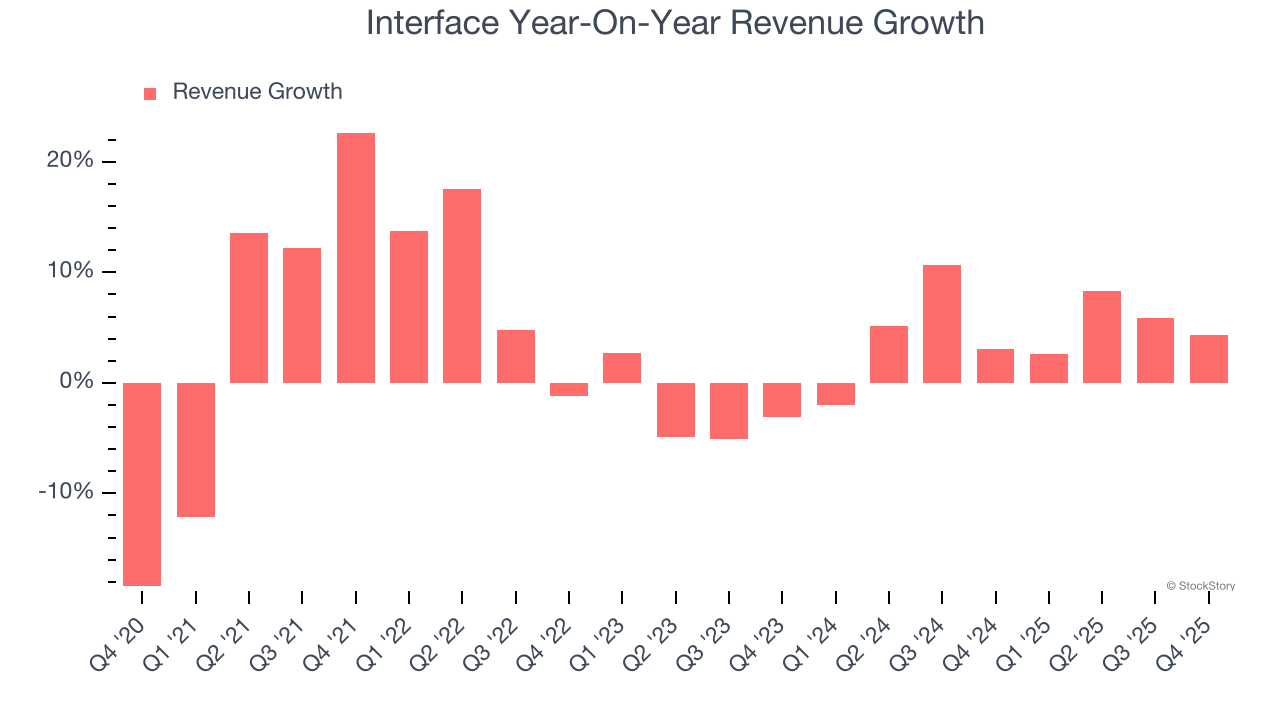
This quarter, Interface grew its revenue by 4.3% year on year, and its $349.4 million of revenue was in line with Wall Street’s estimates. Company management is currently guiding for a 7.6% year-on-year increase in sales next quarter.
Looking further ahead, sell-side analysts expect revenue to grow 4.2% over the next 12 months, similar to its two-year rate. This projection doesn't excite us and indicates its newer products and services will not accelerate its top-line performance yet.
The 1999 book Gorilla Game predicted Microsoft and Apple would dominate tech before it happened. Its thesis? Identify the platform winners early. Today, enterprise software companies embedding generative AI are becoming the new gorillas. a profitable, fast-growing enterprise software stock that is already riding the automation wave and looking to catch the generative AI next.
Operating Margin
Operating margin is an important measure of profitability as it shows the portion of revenue left after accounting for all core expenses – everything from the cost of goods sold to advertising and wages. It’s also useful for comparing profitability across companies with different levels of debt and tax rates because it excludes interest and taxes.
Interface was profitable over the last five years but held back by its large cost base. Its average operating margin of 9% was weak for a business services business.
On the plus side, Interface’s operating margin rose by 3.1 percentage points over the last five years, as its sales growth gave it operating leverage.
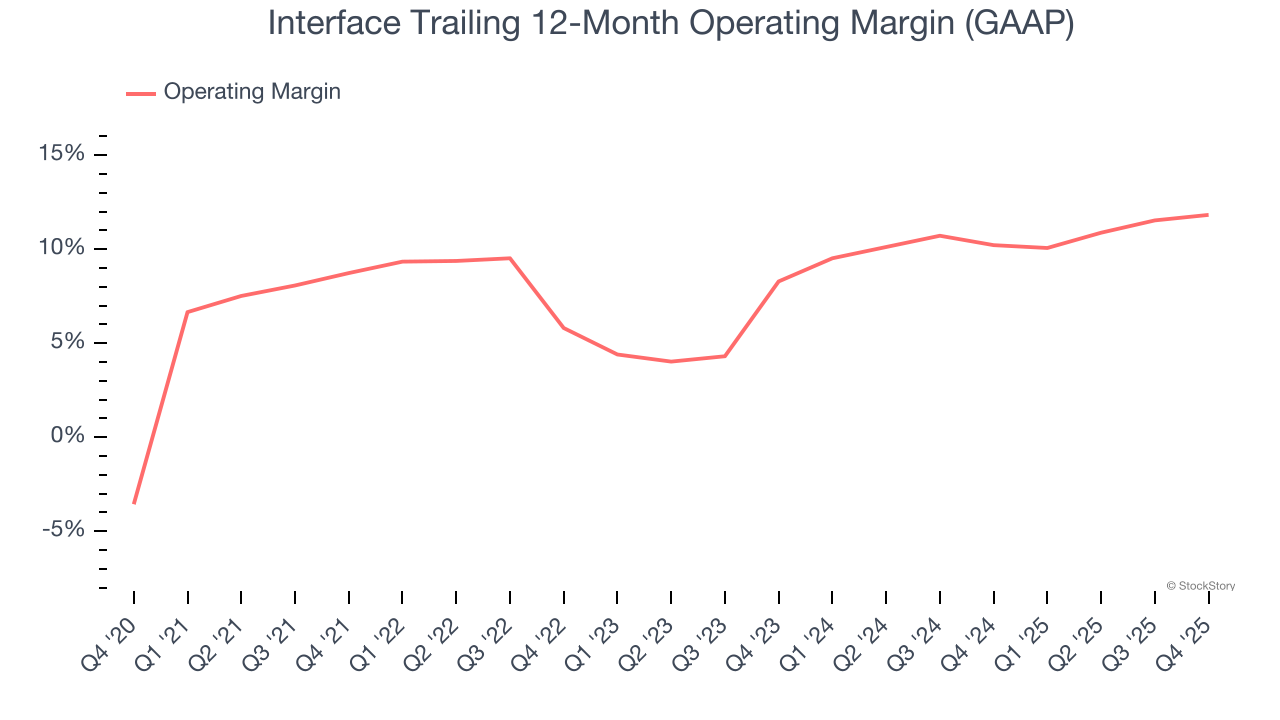
In Q4, Interface generated an operating margin profit margin of 10.1%, up 1.3 percentage points year on year. This increase was a welcome development and shows it was more efficient.
Earnings Per Share
We track the long-term change in earnings per share (EPS) for the same reason as long-term revenue growth. Compared to revenue, however, EPS highlights whether a company’s growth is profitable.
Interface’s EPS grew at a remarkable 11.3% compounded annual growth rate over the last five years, higher than its 4.7% annualized revenue growth. This tells us the company became more profitable on a per-share basis as it expanded.
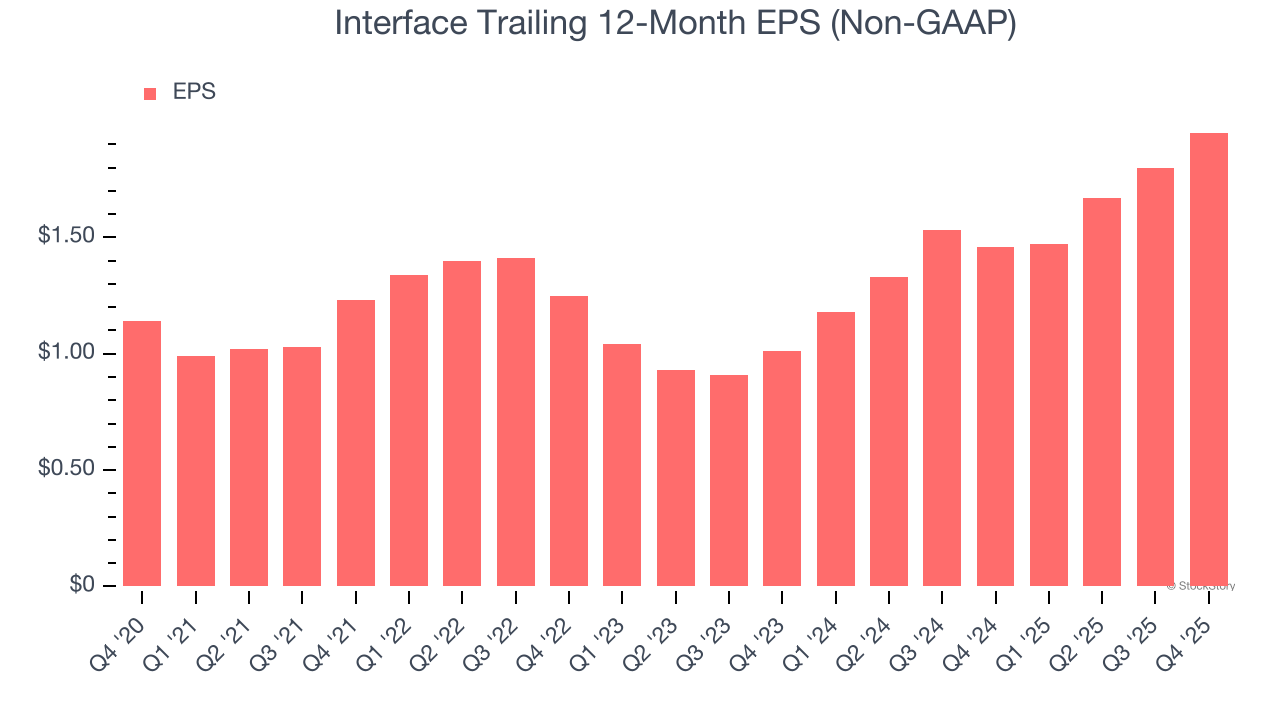
We can take a deeper look into Interface’s earnings quality to better understand the drivers of its performance. As we mentioned earlier, Interface’s operating margin expanded by 3.1 percentage points over the last five years. This was the most relevant factor (aside from the revenue impact) behind its higher earnings; interest expenses and taxes can also affect EPS but don’t tell us as much about a company’s fundamentals.
Like with revenue, we analyze EPS over a shorter period to see if we are missing a change in the business.
For Interface, its two-year annual EPS growth of 38.9% was higher than its five-year trend. We love it when earnings growth accelerates, especially when it accelerates off an already high base.
In Q4, Interface reported adjusted EPS of $0.49, up from $0.34 in the same quarter last year. This print easily cleared analysts’ estimates, and shareholders should be content with the results. Over the next 12 months, Wall Street expects Interface’s full-year EPS of $1.95 to grow 3.8%.
Key Takeaways from Interface’s Q4 Results
It was good to see Interface beat analysts’ EPS expectations this quarter. We were also glad its revenue guidance for next quarter exceeded Wall Street’s estimates. On the other hand, its full-year revenue guidance slightly missed. Overall, we think this was still a solid quarter with some key areas of upside. The stock remained flat at $31.68 immediately following the results.
Sure, Interface had a solid quarter, but if we look at the bigger picture, is this stock a buy? The latest quarter does matter, but not nearly as much as longer-term fundamentals and valuation, when deciding if the stock is a buy. We cover that in our actionable full research report which you can read here (it’s free).