
Identification solutions manufacturer Brady (NYSE: BRC) missed Wall Street’s revenue expectations in Q1 CY2025, but sales rose 11.4% year on year to $382.6 million. Its non-GAAP profit of $1.22 per share was in line with analysts’ consensus estimates.
Is now the time to buy Brady? Find out by accessing our full research report, it’s free.
Brady (BRC) Q1 CY2025 Highlights:
- Revenue: $382.6 million vs analyst estimates of $386.6 million (11.4% year-on-year growth, 1% miss)
- Adjusted EPS: $1.22 vs analyst estimates of $1.22 (in line)
- Management reiterated its full-year Adjusted EPS guidance of $4.56 at the midpoint
- Operating Margin: 17.6%, in line with the same quarter last year
- Free Cash Flow Margin: 14.5%, down from 18.8% in the same quarter last year
- Market Capitalization: $3.64 billion
Commentary:“Our organic sales growth in the Americas & Asia region was strong this quarter, which was driven by our increased investments in research and development and new product launches over the last several years. The result was a new all-time company record quarter of adjusted earnings per share,” said Brady’s President and Chief Executive Officer, Russell R. Shaller.
Company Overview
Founded in 1914 and evolving through more than a century of industrial innovation, Brady (NYSE: BRC) manufactures and supplies identification solutions and workplace safety products that help companies identify and protect their premises, products, and people.
Sales Growth
Examining a company’s long-term performance can provide clues about its quality. Any business can put up a good quarter or two, but the best consistently grow over the long haul.
With $1.46 billion in revenue over the past 12 months, Brady is a small player in the business services space, which sometimes brings disadvantages compared to larger competitors benefiting from economies of scale and numerous distribution channels. On the bright side, it can grow faster because it has more room to expand.
As you can see below, Brady’s 5.4% annualized revenue growth over the last five years was decent. This shows its offerings generated slightly more demand than the average business services company, a useful starting point for our analysis.
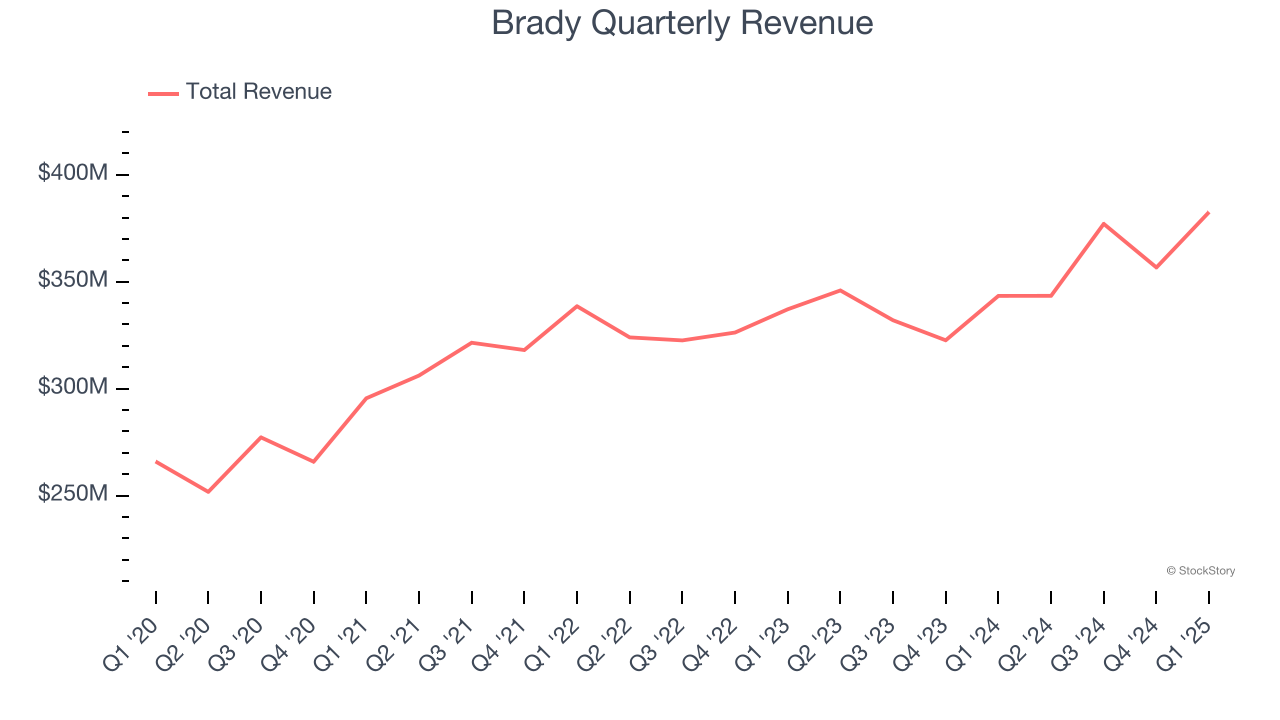
Long-term growth is the most important, but within business services, a half-decade historical view may miss new innovations or demand cycles. Brady’s annualized revenue growth of 5.6% over the last two years aligns with its five-year trend, suggesting its demand was stable. 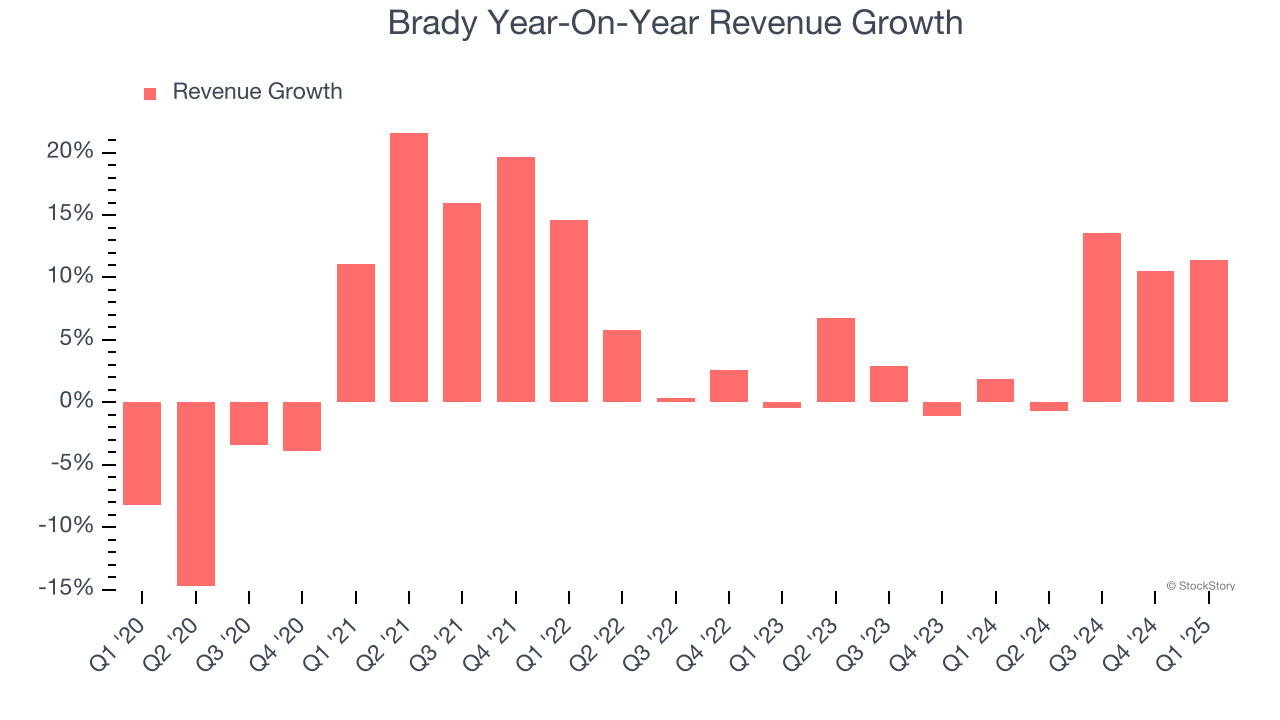
This quarter, Brady’s revenue grew by 11.4% year on year to $382.6 million but fell short of Wall Street’s estimates.
Looking ahead, sell-side analysts expect revenue to grow 6.3% over the next 12 months, similar to its two-year rate. This projection is above average for the sector and suggests its newer products and services will help support its recent top-line performance.
Software is eating the world and there is virtually no industry left that has been untouched by it. That drives increasing demand for tools helping software developers do their jobs, whether it be monitoring critical cloud infrastructure, integrating audio and video functionality, or ensuring smooth content streaming. Click here to access a free report on our 3 favorite stocks to play this generational megatrend.
Operating Margin
Operating margin is one of the best measures of profitability because it tells us how much money a company takes home after subtracting all core expenses, like marketing and R&D.
Brady has been an efficient company over the last five years. It was one of the more profitable businesses in the business services sector, boasting an average operating margin of 16.1%.
Analyzing the trend in its profitability, Brady’s operating margin rose by 2.4 percentage points over the last five years, as its sales growth gave it operating leverage.
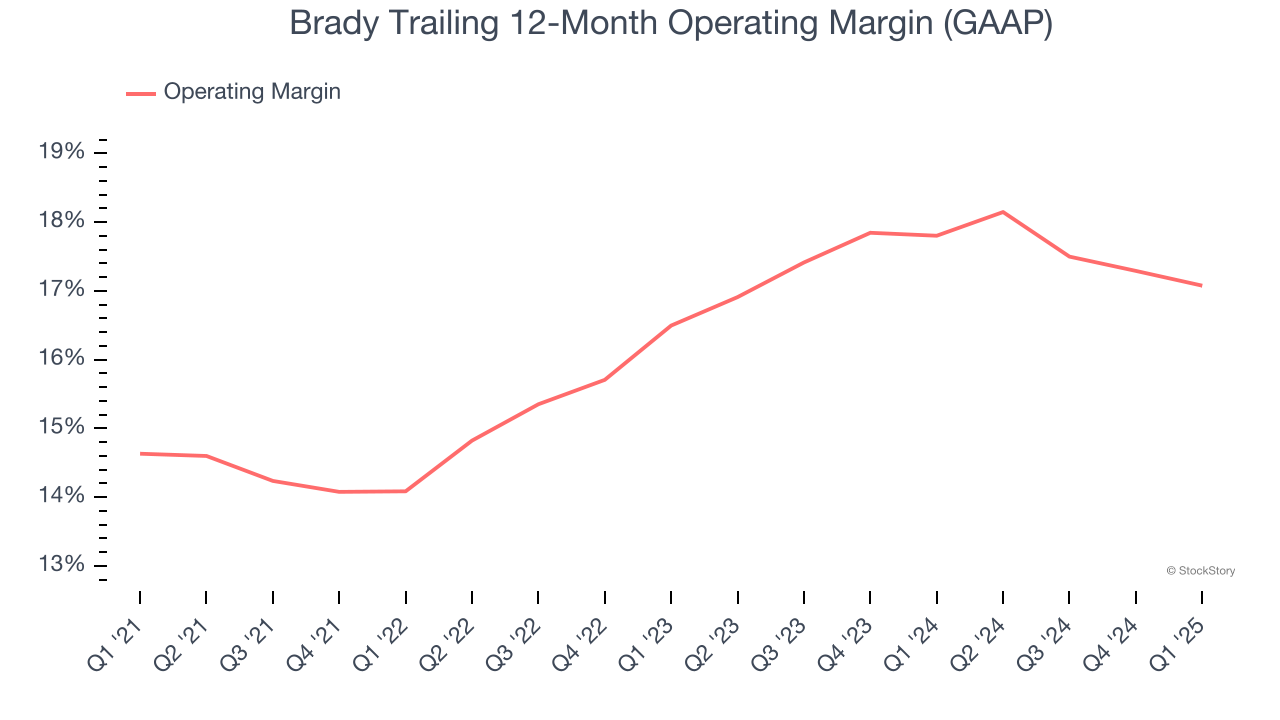
In Q1, Brady generated an operating profit margin of 17.6%, in line with the same quarter last year. This indicates the company’s overall cost structure has been relatively stable.
Earnings Per Share
We track the long-term change in earnings per share (EPS) for the same reason as long-term revenue growth. Compared to revenue, however, EPS highlights whether a company’s growth is profitable.
Brady’s EPS grew at a spectacular 12.9% compounded annual growth rate over the last five years, higher than its 5.4% annualized revenue growth. This tells us the company became more profitable on a per-share basis as it expanded.
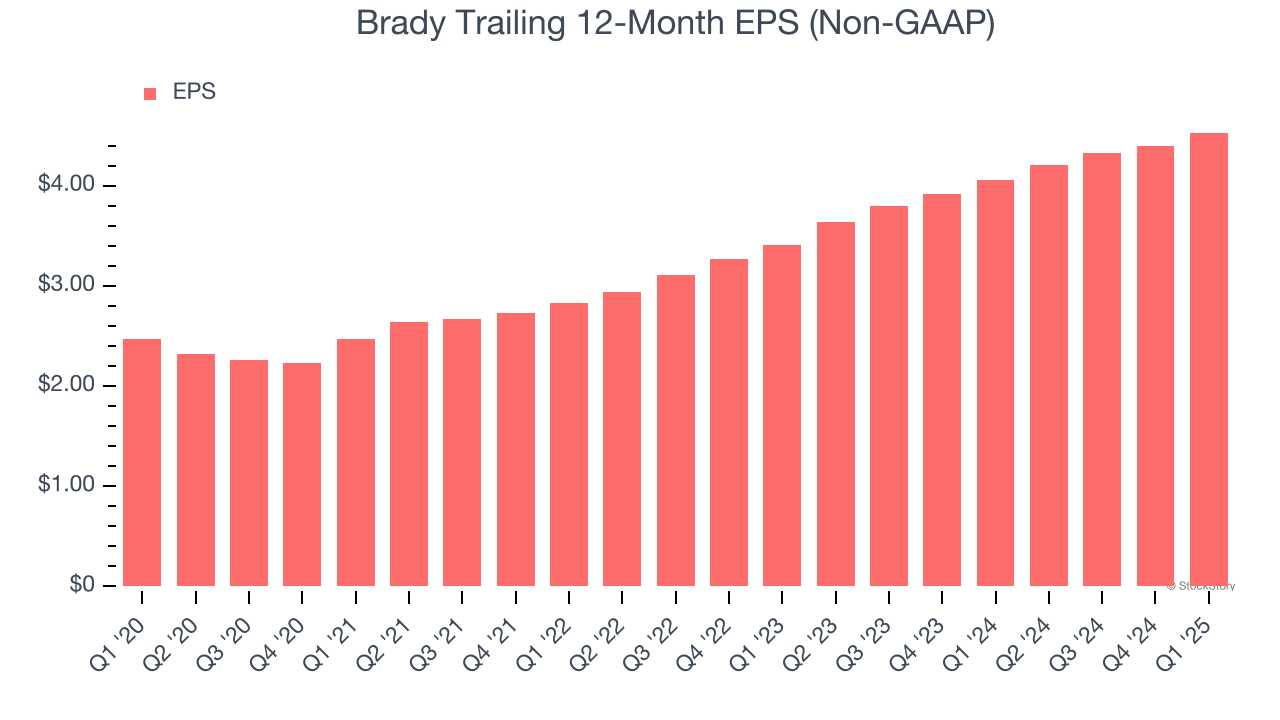
We can take a deeper look into Brady’s earnings quality to better understand the drivers of its performance. As we mentioned earlier, Brady’s operating margin was flat this quarter but expanded by 2.4 percentage points over the last five years. On top of that, its share count shrank by 9.3%. These are positive signs for shareholders because improving profitability and share buybacks turbocharge EPS growth relative to revenue growth. 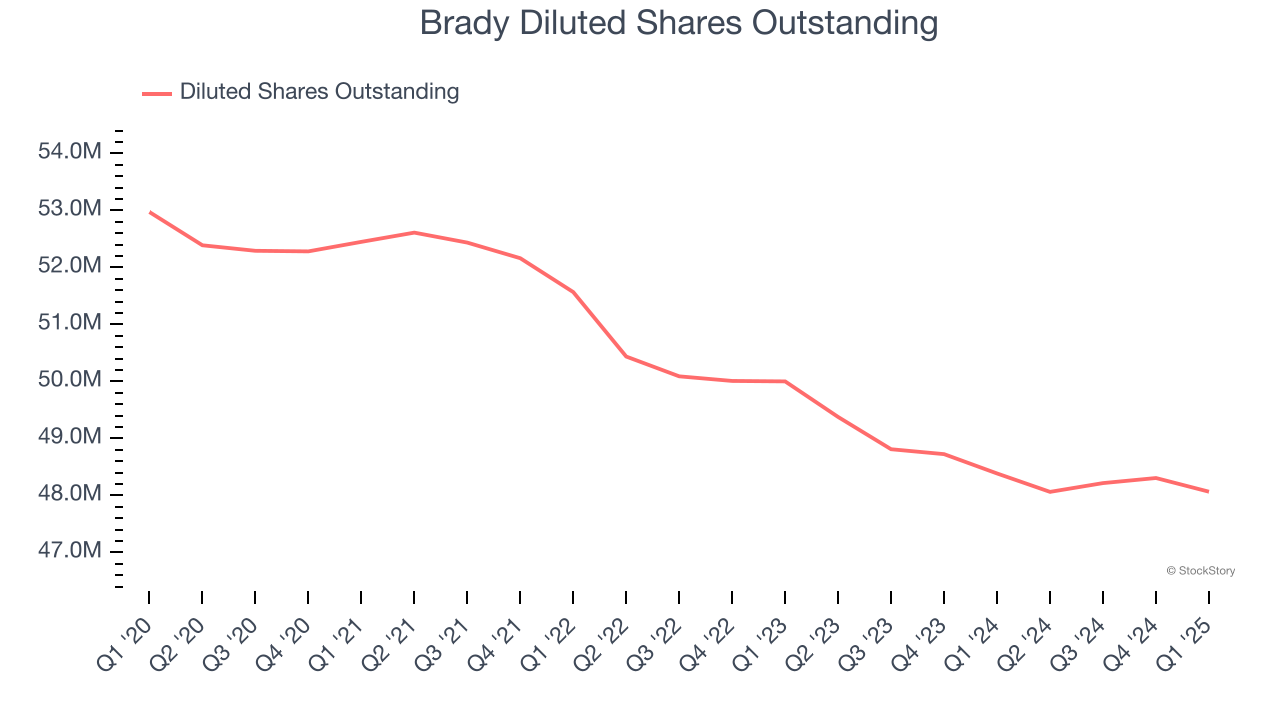
In Q1, Brady reported EPS at $1.22, up from $1.09 in the same quarter last year. This print was close to analysts’ estimates. Over the next 12 months, Wall Street expects Brady’s full-year EPS of $4.53 to grow 8.6%.
Key Takeaways from Brady’s Q1 Results
We struggled to find many positives in these results. Its revenue slightly missed and its full-year EPS guidance fell slightly short of Wall Street’s estimates. Overall, this was a softer quarter. The stock traded down 2.8% to $74.10 immediately after reporting.
Brady underperformed this quarter, but does that create an opportunity to invest right now? When making that decision, it’s important to consider its valuation, business qualities, as well as what has happened in the latest quarter. We cover that in our actionable full research report which you can read here, it’s free.


