Freight delivery company XPO (NYSE: XPO) met Wall Street’s revenue expectations in Q4 CY2024, but sales were flat year on year at $1.92 billion. Its non-GAAP profit of $0.89 per share was 41.6% above analysts’ consensus estimates.
Is now the time to buy XPO? Find out by accessing our full research report, it’s free.
XPO (XPO) Q4 CY2024 Highlights:
- Revenue: $1.92 billion vs analyst estimates of $1.92 billion (flat year on year, in line)
- Adjusted EPS: $0.89 vs analyst estimates of $0.63 (41.6% beat)
- Adjusted EBITDA: $303 million vs analyst estimates of $268.3 million (15.8% margin, 12.9% beat)
- “We’ve entered 2025 with strong momentum, following landmark network investments that strengthen our competitive position in a freight market recovery and for the long-term."
- Operating Margin: 7.7%, up from 6.1% in the same quarter last year
- Free Cash Flow was $23 million, up from -$778 million in the same quarter last year
- Market Capitalization: $15.87 billion
Mario Harik, chief executive officer of XPO, said, “We’re pleased to report a strong fourth quarter that caps a year of above-market earnings growth. Companywide, we delivered full-year increases of 27% in adjusted EBITDA and 31% in adjusted diluted EPS, compared with the prior year.
Company Overview
Owning a mobile game simulating freight operations for the Tour de France, XPO (NYSE: XPO) is a transportation company specializing in expedited shipping services.
Ground Transportation
The growth of e-commerce and global trade continues to drive demand for shipping services, especially last-mile delivery, presenting opportunities for ground transportation companies. The industry continues to invest in data, analytics, and autonomous fleets to optimize efficiency and find the most cost-effective routes. Despite the essential services this industry provides, ground transportation companies are still at the whim of economic cycles. Consumer spending, for example, can greatly impact the demand for these companies’ offerings while fuel costs can influence profit margins.
Sales Growth
A company’s long-term sales performance can indicate its overall quality. Any business can put up a good quarter or two, but many enduring ones grow for years. XPO struggled to consistently generate demand over the last five years as its sales dropped at a 13.5% annual rate. This fell short of our benchmarks and is a sign of poor business quality.
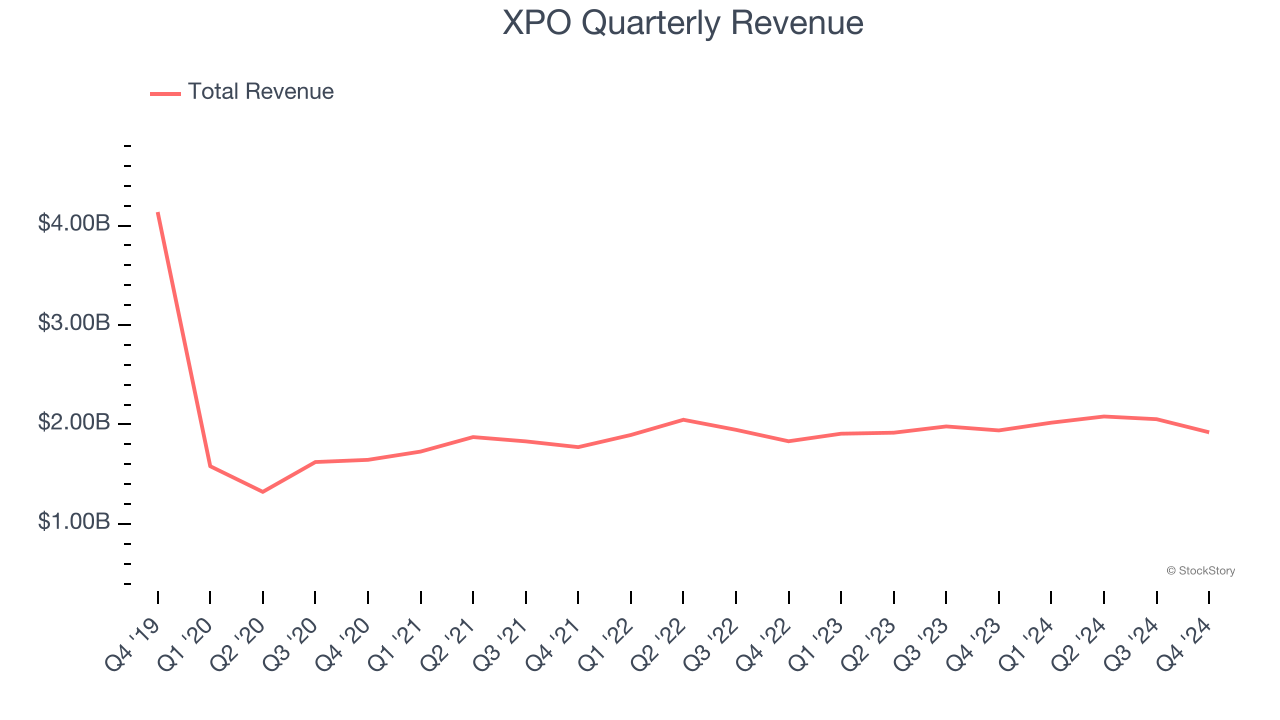
Long-term growth is the most important, but within industrials, a half-decade historical view may miss new industry trends or demand cycles. XPO’s annualized revenue growth of 2.3% over the last two years is above its five-year trend, but we were still disappointed by the results. We also note many other Ground Transportation businesses have faced declining sales because of cyclical headwinds. While XPO grew slower than we’d like, it did perform better than its peers. 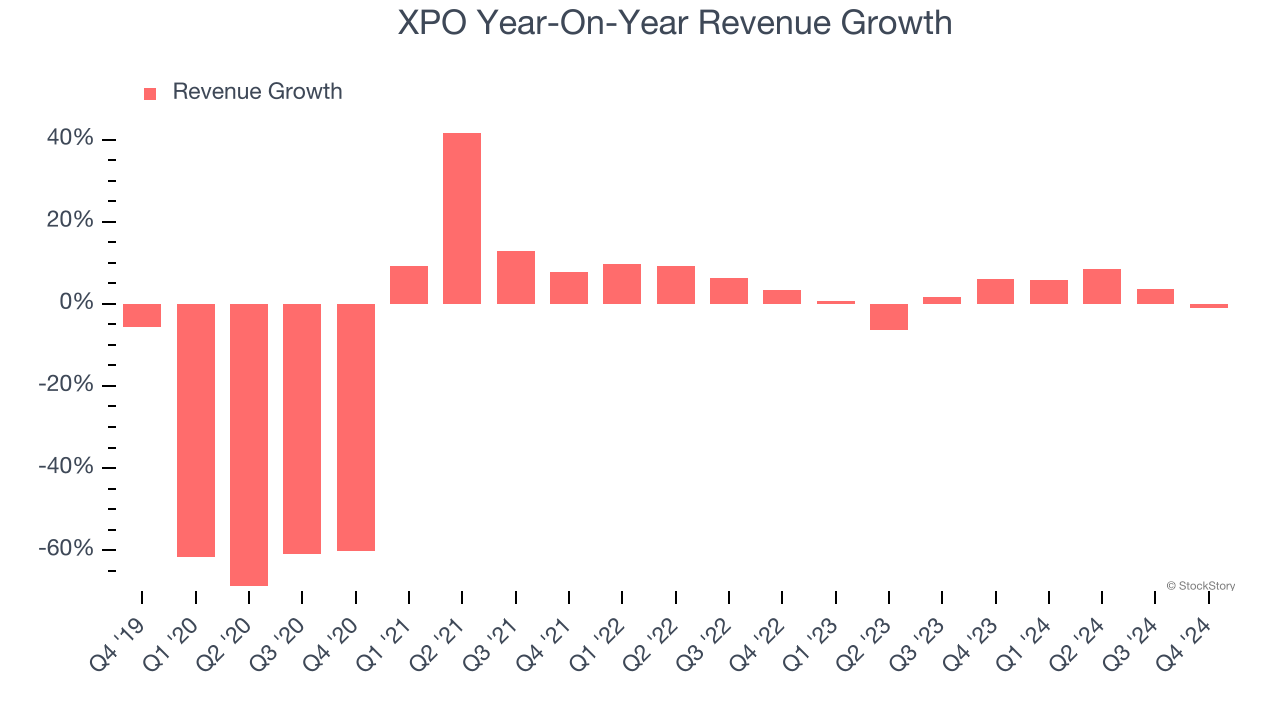
We can dig further into the company’s revenue dynamics by analyzing its most important segments, North American Less-Than-Truckload and European Transportation , which are 60.2% and 39.8% of revenue. Over the last two years, XPO’s North American Less-Than-Truckload revenue (freight services) averaged 2.9% year-on-year growth while its European Transportation revenue (truckload, less-than-truckload, and truck brokerage) averaged 1.7% growth.
This quarter, XPO’s $1.92 billion of revenue was flat year on year and in line with Wall Street’s estimates.
Looking ahead, sell-side analysts expect revenue to grow 2.5% over the next 12 months, similar to its two-year rate. This projection is underwhelming and suggests its newer products and services will not accelerate its top-line performance yet.
Today’s young investors won’t have read the timeless lessons in Gorilla Game: Picking Winners In High Technology because it was written more than 20 years ago when Microsoft and Apple were first establishing their supremacy. But if we apply the same principles, then enterprise software stocks leveraging their own generative AI capabilities may well be the Gorillas of the future. So, in that spirit, we are excited to present our Special Free Report on a profitable, fast-growing enterprise software stock that is already riding the automation wave and looking to catch the generative AI next.
Operating Margin
Operating margin is an important measure of profitability as it shows the portion of revenue left after accounting for all core expenses – everything from the cost of goods sold to advertising and wages. It’s also useful for comparing profitability across companies with different levels of debt and tax rates because it excludes interest and taxes.
XPO was profitable over the last five years but held back by its large cost base. Its average operating margin of 5.1% was weak for an industrials business.
On the plus side, XPO’s operating margin rose by 6.6 percentage points over the last five years.
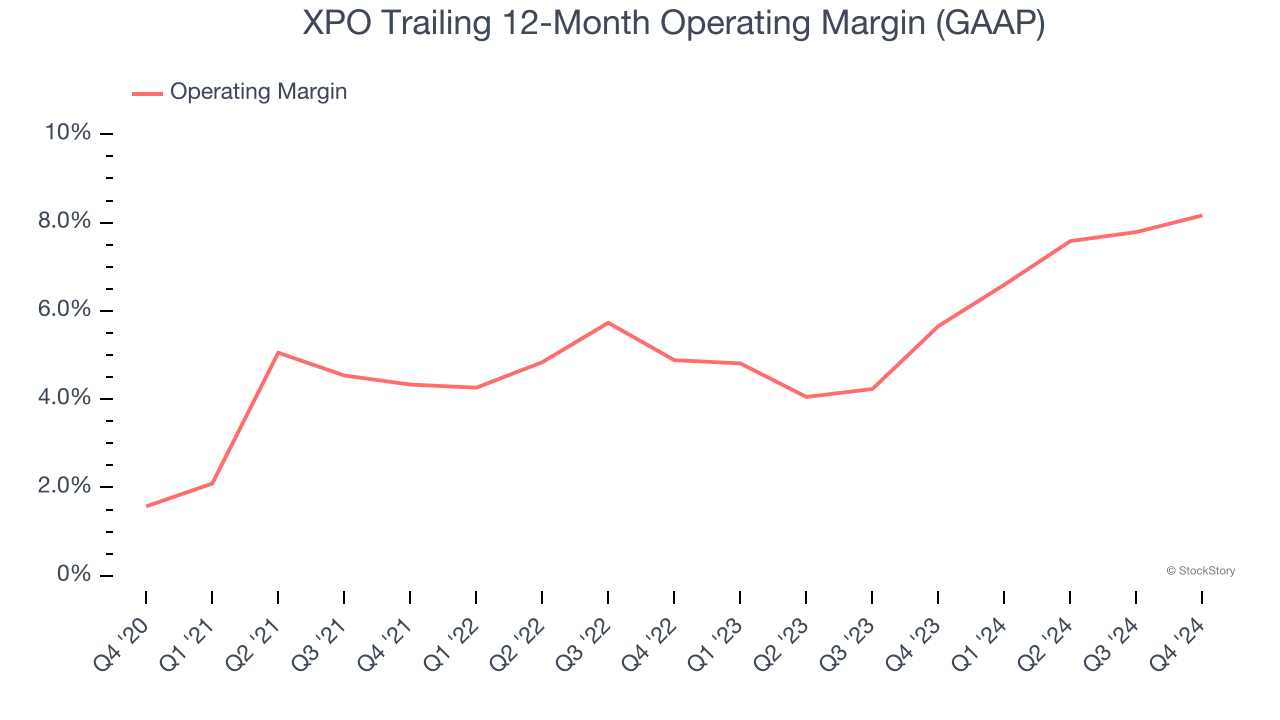
This quarter, XPO generated an operating profit margin of 7.7%, up 1.6 percentage points year on year. This increase was a welcome development and shows it was recently more efficient because its expenses grew slower than its revenue.
Earnings Per Share
Revenue trends explain a company’s historical growth, but the long-term change in earnings per share (EPS) points to the profitability of that growth – for example, a company could inflate its sales through excessive spending on advertising and promotions.
Sadly for XPO, its EPS and revenue declined by 1.3% and 13.5% annually over the last five years. We tend to steer our readers away from companies with falling revenue and EPS, where diminishing earnings could imply changing secular trends and preferences. If the tide turns unexpectedly, XPO’s low margin of safety could leave its stock price susceptible to large downswings.
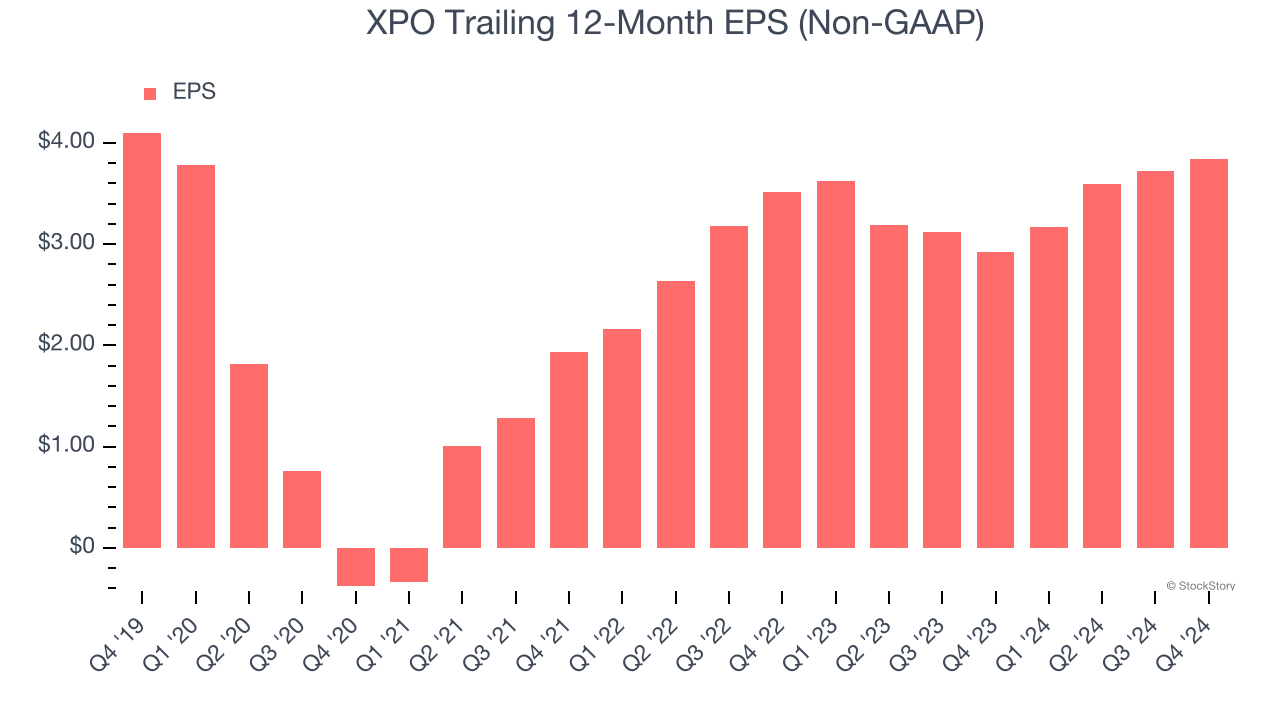
Like with revenue, we analyze EPS over a shorter period to see if we are missing a change in the business.
For XPO, its two-year annual EPS growth of 4.5% was higher than its five-year trend. Accelerating earnings growth is almost always an encouraging data point.
In Q4, XPO reported EPS at $0.89, up from $0.78 in the same quarter last year. This print easily cleared analysts’ estimates, and shareholders should be content with the results. Over the next 12 months, Wall Street expects XPO’s full-year EPS of $3.84 to grow 8.5%.
Key Takeaways from XPO’s Q4 Results
We were impressed by how significantly XPO blew past analysts’ EPS expectations this quarter. We were also excited its EBITDA outperformed Wall Street’s estimates by a wide margin. Zooming out, we think this quarter featured some important positives. The stock traded up 1% to $137.81 immediately after reporting.
Sure, XPO had a solid quarter, but if we look at the bigger picture, is this stock a buy? We think that the latest quarter is only one piece of the longer-term business quality puzzle. Quality, when combined with valuation, can help determine if the stock is a buy. We cover that in our actionable full research report which you can read here, it’s free.


