
Homebuilder Lennar (NYSE: LEN) reported revenue ahead of Wall Streets expectations in Q4 CY2025, but sales fell by 5.8% year on year to $9.37 billion. Its GAAP profit of $1.93 per share was 12.6% below analysts’ consensus estimates.
Is now the time to buy Lennar? Find out by accessing our full research report, it’s free for active Edge members.
Lennar (LEN) Q4 CY2025 Highlights:
- Revenue: $9.37 billion vs analyst estimates of $9.13 billion (5.8% year-on-year decline, 2.6% beat)
- EPS (GAAP): $1.93 vs analyst expectations of $2.21 (12.6% miss)
- Operating Margin: 7.8%, down from 13.7% in the same quarter last year
- Backlog: $5.2 billion at quarter end, down 3.2% year on year
- Market Capitalization: $29.36 billion
Stuart Miller, Executive Chairman and Co-Chief Executive Officer of Lennar, said, "Even as interest rates moved slightly lower in our fourth quarter, the overall market remained challenged. Accordingly, our fourth quarter and full year 2025 results reflect a disciplined commitment to increasing housing supply in a market constrained by affordability challenges, as well as weak consumer confidence. Despite the added pressure of a six-week government shutdown, we continued to build and sell homes, adapting as needed to changing market conditions."
Company Overview
One of the largest homebuilders in America, Lennar (NYSE: LEN) is known for constructing affordable, move-up, and retirement homes across a range of markets and communities.
Revenue Growth
A company’s long-term sales performance can indicate its overall quality. Any business can experience short-term success, but top-performing ones enjoy sustained growth for years. Over the last five years, Lennar grew its sales at a decent 8.7% compounded annual growth rate. Its growth was slightly above the average industrials company and shows its offerings resonate with customers.
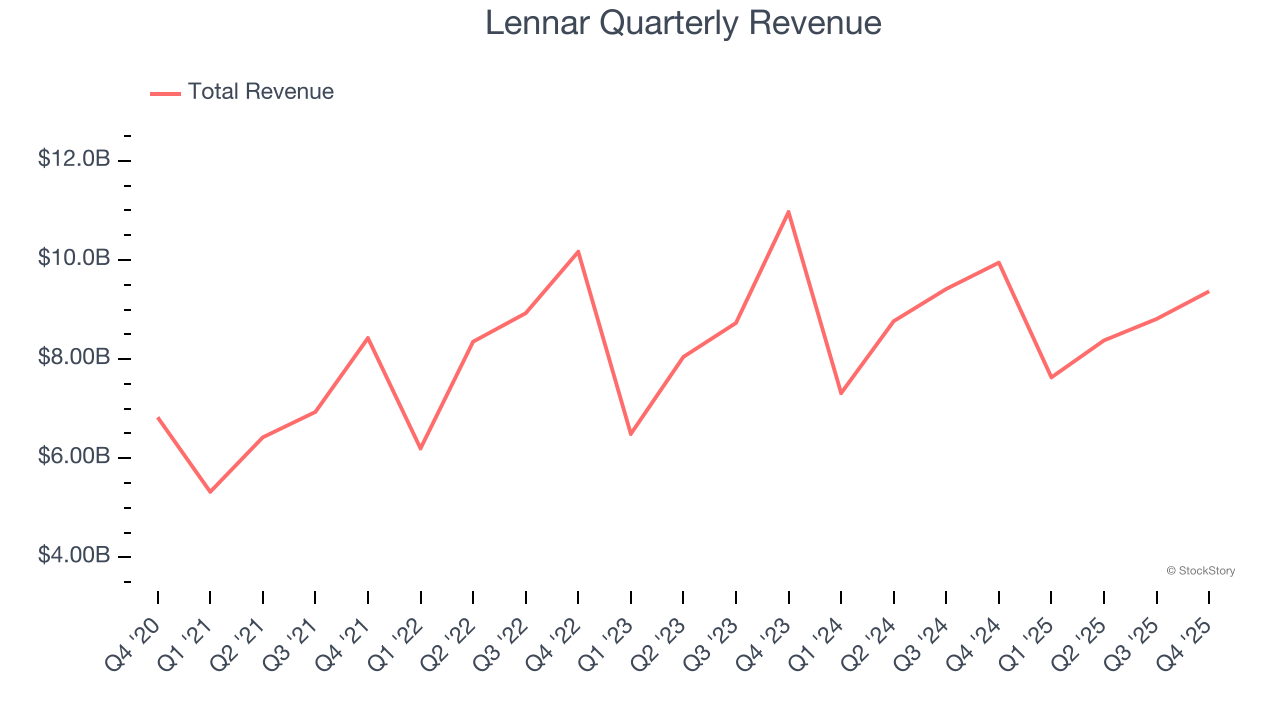
Long-term growth is the most important, but within industrials, a half-decade historical view may miss new industry trends or demand cycles. Lennar’s recent performance shows its demand has slowed as its revenue was flat over the last two years. 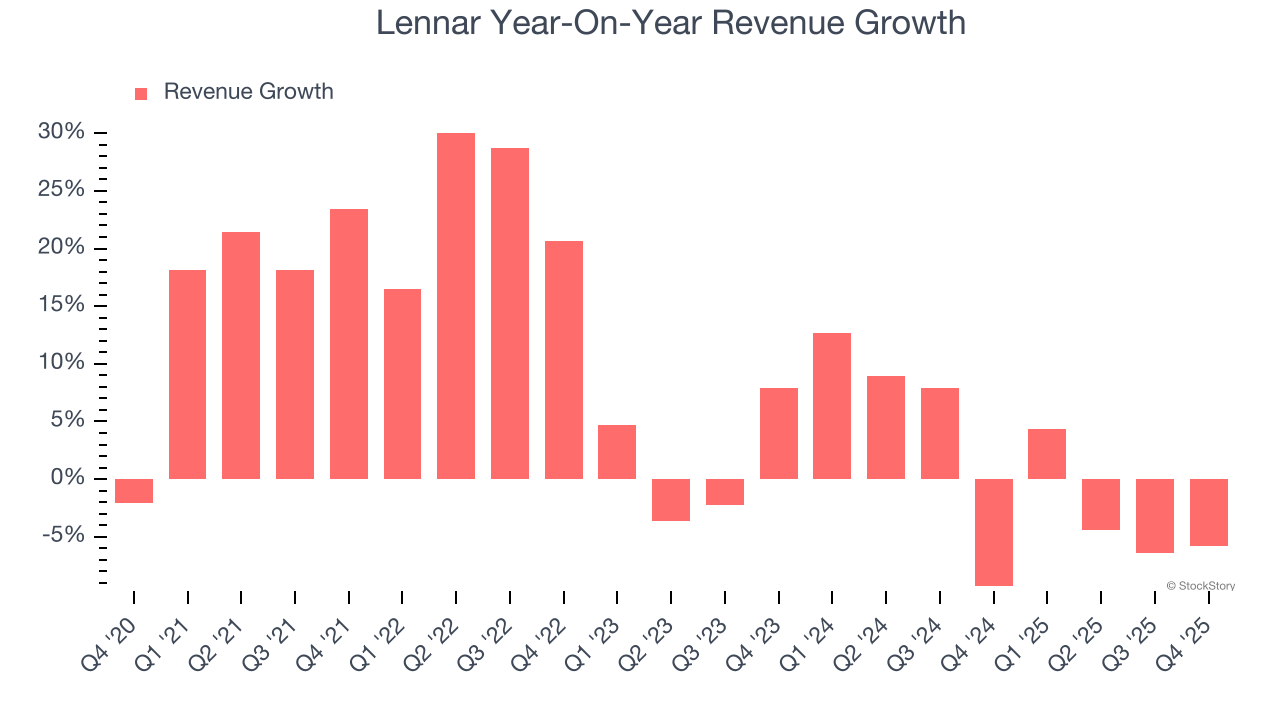
Lennar also reports its backlog, or the value of its outstanding orders that have not yet been executed or delivered. Lennar’s backlog reached $5.2 billion in the latest quarter and averaged 16.6% year-on-year declines over the last two years. Because this number is lower than its revenue growth, we can see the company hasn’t secured enough new orders to maintain its growth rate in the future. 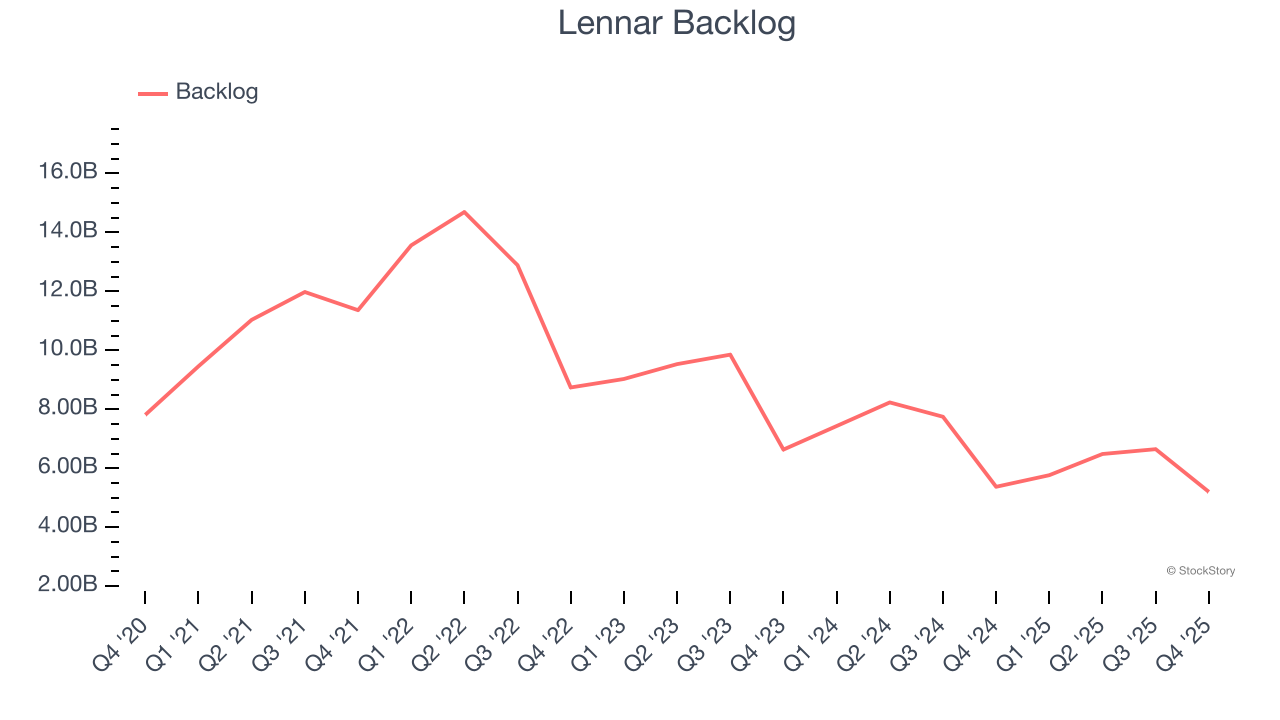
This quarter, Lennar’s revenue fell by 5.8% year on year to $9.37 billion but beat Wall Street’s estimates by 2.6%.
Looking ahead, sell-side analysts expect revenue to grow 2.8% over the next 12 months. While this projection indicates its newer products and services will fuel better top-line performance, it is still below the sector average.
Microsoft, Alphabet, Coca-Cola, Monster Beverage—all began as under-the-radar growth stories riding a massive trend. We’ve identified the next one: a profitable AI semiconductor play Wall Street is still overlooking. Go here for access to our full report.
Operating Margin
Lennar has been an efficient company over the last five years. It was one of the more profitable businesses in the industrials sector, boasting an average operating margin of 15%. This result was particularly impressive because of its low gross margin, which is mostly a factor of what it sells and takes huge shifts to move meaningfully. Companies have more control over their operating margins, and it’s a show of well-managed operations if they’re high when gross margins are low.
Analyzing the trend in its profitability, Lennar’s operating margin decreased by 10.7 percentage points over the last five years. This raises questions about the company’s expense base because its revenue growth should have given it leverage on its fixed costs, resulting in better economies of scale and profitability.
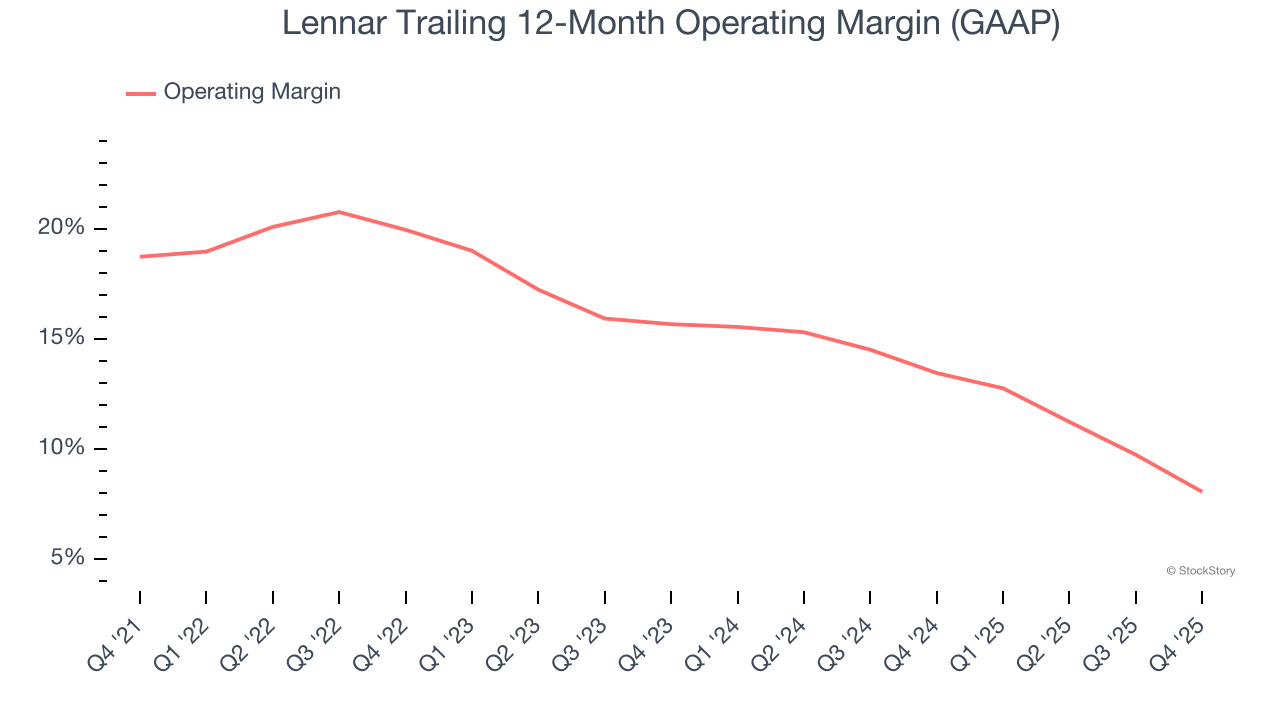
This quarter, Lennar generated an operating margin profit margin of 7.8%, down 5.9 percentage points year on year. Since Lennar’s operating margin decreased more than its gross margin, we can assume it was less efficient because expenses such as marketing, R&D, and administrative overhead increased.
Earnings Per Share
We track the long-term change in earnings per share (EPS) for the same reason as long-term revenue growth. Compared to revenue, however, EPS highlights whether a company’s growth is profitable.
Lennar’s flat EPS over the last five years was below its 8.7% annualized revenue growth. This tells us the company became less profitable on a per-share basis as it expanded due to non-fundamental factors such as interest expenses and taxes.
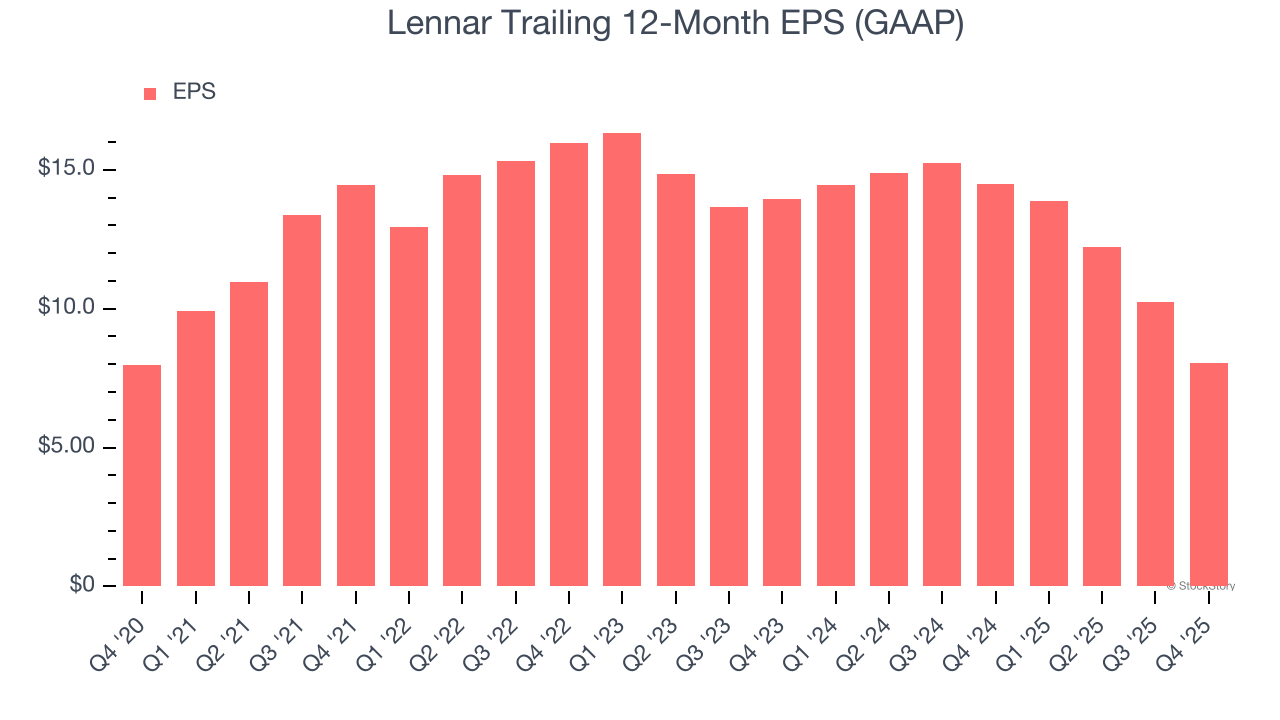
We can take a deeper look into Lennar’s earnings to better understand the drivers of its performance. As we mentioned earlier, Lennar’s operating margin declined by 10.7 percentage points over the last five years. This was the most relevant factor (aside from the revenue impact) behind its lower earnings; interest expenses and taxes can also affect EPS but don’t tell us as much about a company’s fundamentals.
Like with revenue, we analyze EPS over a shorter period to see if we are missing a change in the business.
For Lennar, its two-year annual EPS declines of 24% show its recent history was to blame for its underperformance over the last five years. These results were bad no matter how you slice the data.
In Q4, Lennar reported EPS of $1.93, down from $4.10 in the same quarter last year. This print missed analysts’ estimates. Over the next 12 months, Wall Street expects Lennar’s full-year EPS of $8.05 to grow 11.8%.
Key Takeaways from Lennar’s Q4 Results
We enjoyed seeing Lennar beat analysts’ revenue expectations this quarter. On the other hand, its EPS missed and its backlog fell short of Wall Street’s estimates. Overall, this was a softer quarter. The stock traded down 3.9% to $113.06 immediately after reporting.
Lennar underperformed this quarter, but does that create an opportunity to invest right now? The latest quarter does matter, but not nearly as much as longer-term fundamentals and valuation, when deciding if the stock is a buy. We cover that in our actionable full research report which you can read here, it’s free for active Edge members.


