
Athletic apparel company Under Armour (NYSE: UAA) beat Wall Street’s revenue expectations in Q3 CY2025, but sales fell by 4.7% year on year to $1.33 billion. Its non-GAAP profit of $0.04 per share was $0.02 above analysts’ consensus estimates.
Is now the time to buy Under Armour? Find out by accessing our full research report, it’s free for active Edge members.
Under Armour (UAA) Q3 CY2025 Highlights:
- Revenue: $1.33 billion vs analyst estimates of $1.31 billion (4.7% year-on-year decline, 1.9% beat)
- Adjusted EPS: $0.04 vs analyst estimates of $0.02 ($0.02 beat)
- Adjusted EBITDA: $31.81 million vs analyst estimates of $67.04 million (2.4% margin, 52.6% miss)
- Adjusted EPS guidance for the full year is $0.04 at the midpoint, missing analyst estimates by 32.7%
- Operating Margin: 1.3%, down from 12.4% in the same quarter last year
- Free Cash Flow was -$90.32 million compared to -$367.2 million in the same quarter last year
- Constant Currency Revenue fell 6% year on year (-10.2% in the same quarter last year)
- Market Capitalization: $1.94 billion
"We delivered results ahead of our prior outlook this quarter and are encouraged to see signs of brand momentum in North America – an important milestone in our turnaround," said Under Armour President and CEO Kevin Plank.
Company Overview
Founded in 1996 by a former University of Maryland football player, Under Armour (NYSE: UAA) is an apparel brand specializing in sportswear designed to improve athletic performance.
Revenue Growth
Examining a company’s long-term performance can provide clues about its quality. Any business can experience short-term success, but top-performing ones enjoy sustained growth for years. Unfortunately, Under Armour’s 2.3% annualized revenue growth over the last five years was weak. This was below our standards and is a poor baseline for our analysis.
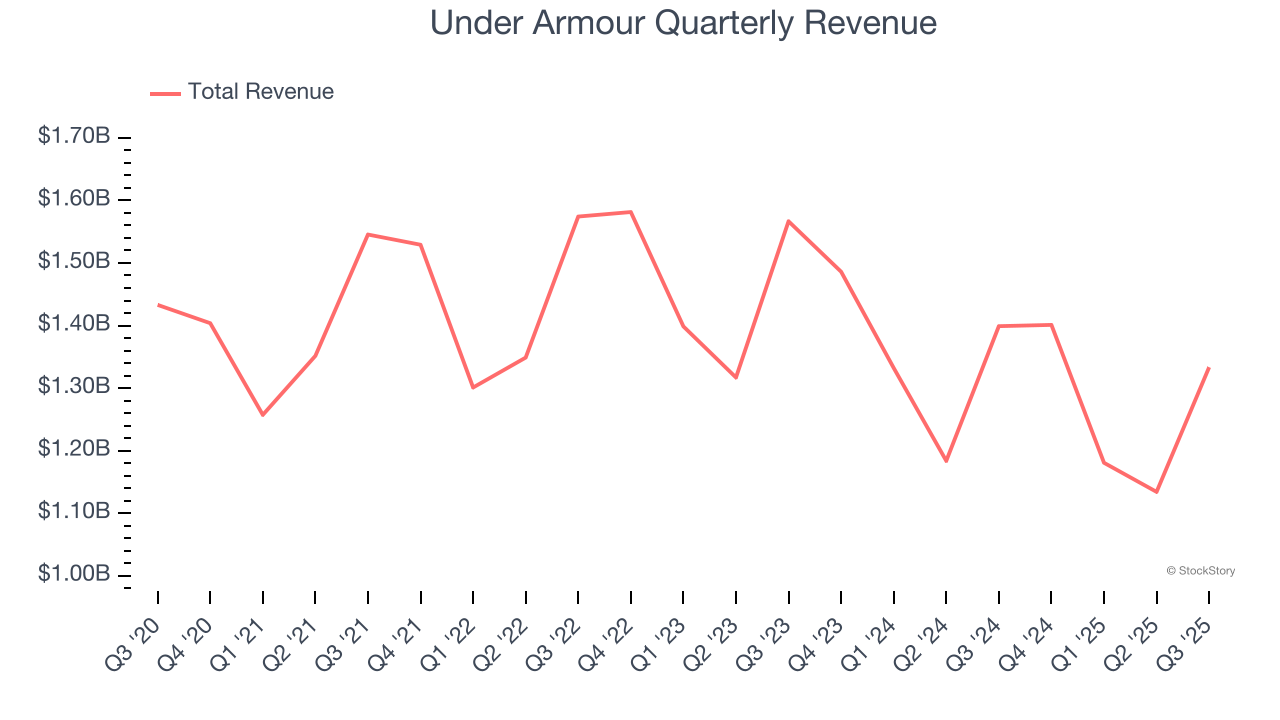
Long-term growth is the most important, but within consumer discretionary, product cycles are short and revenue can be hit-driven due to rapidly changing trends and consumer preferences. Under Armour’s performance shows it grew in the past but relinquished its gains over the last two years, as its revenue fell by 7.2% annually. 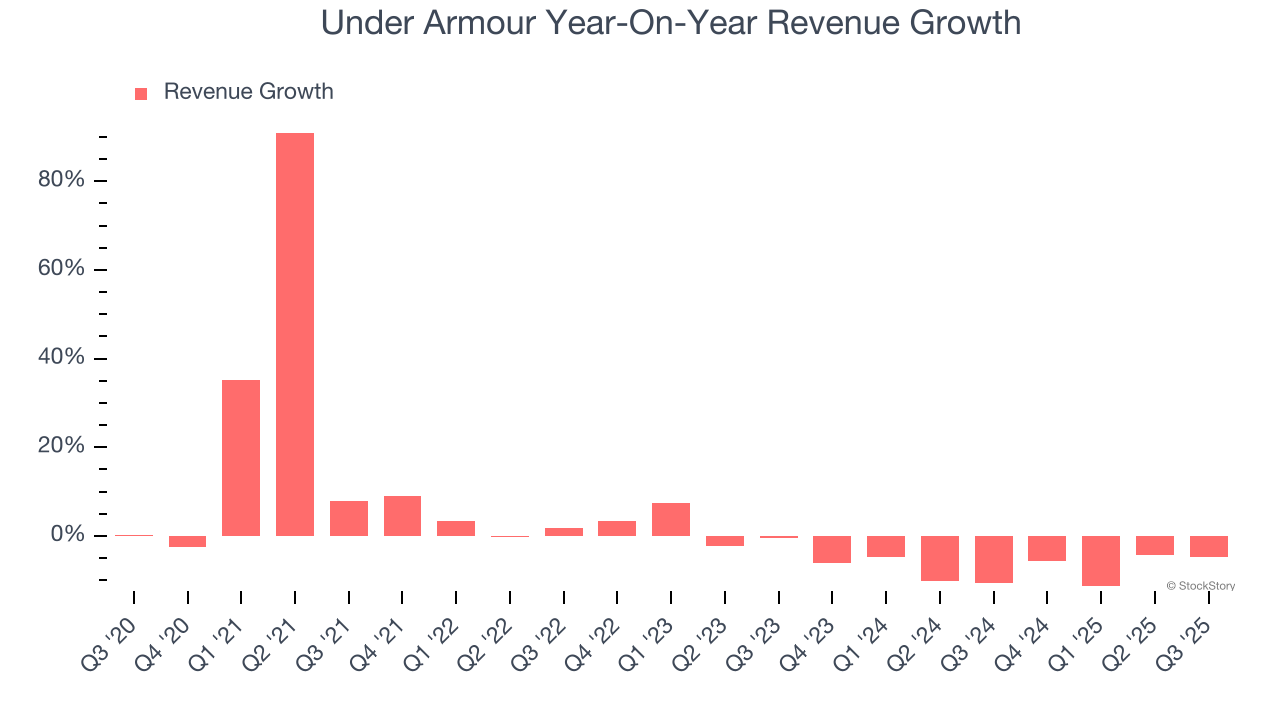
We can dig further into the company’s sales dynamics by analyzing its constant currency revenue, which excludes currency movements that are outside their control and not indicative of demand. Over the last two years, its constant currency sales averaged 7.3% year-on-year declines. Because this number aligns with its normal revenue growth, we can see that Under Armour has properly hedged its foreign currency exposure. 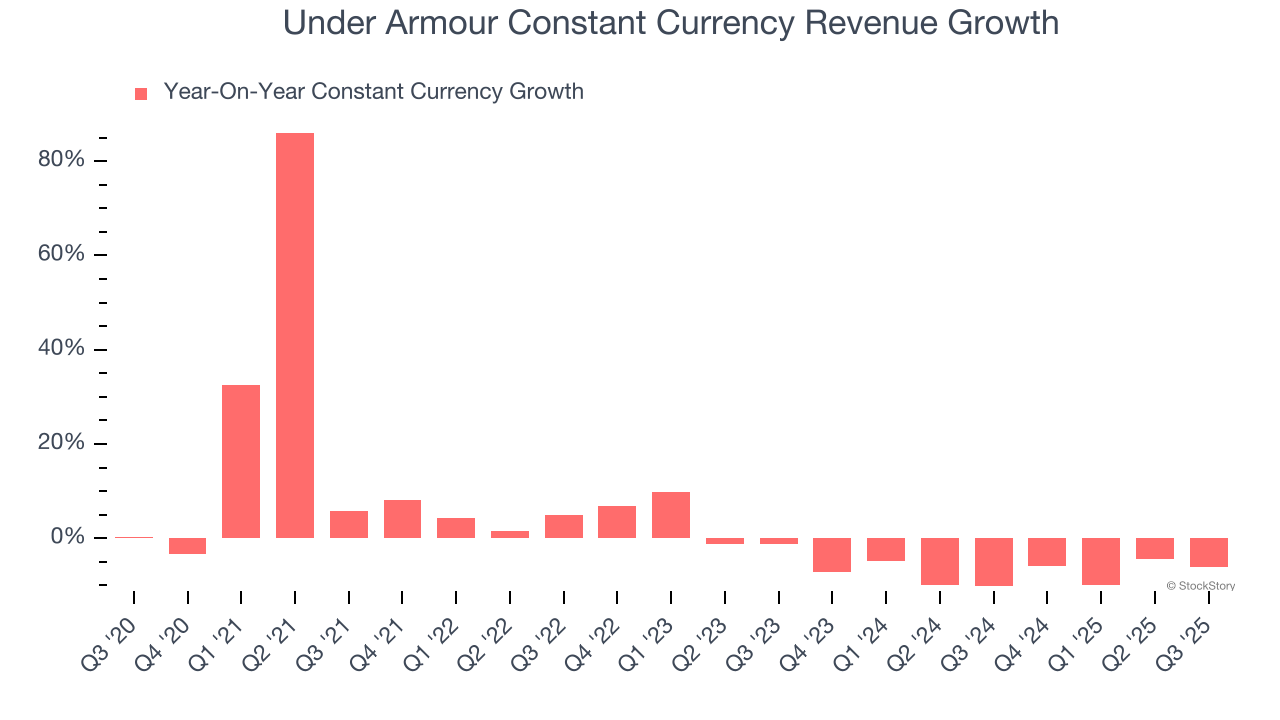
This quarter, Under Armour’s revenue fell by 4.7% year on year to $1.33 billion but beat Wall Street’s estimates by 1.9%.
Looking ahead, sell-side analysts expect revenue to remain flat over the next 12 months. While this projection implies its newer products and services will catalyze better top-line performance, it is still below the sector average.
The 1999 book Gorilla Game predicted Microsoft and Apple would dominate tech before it happened. Its thesis? Identify the platform winners early. Today, enterprise software companies embedding generative AI are becoming the new gorillas. a profitable, fast-growing enterprise software stock that is already riding the automation wave and looking to catch the generative AI next.
Operating Margin
Under Armour’s operating margin might fluctuated slightly over the last 12 months but has remained more or less the same. The company broke even over the last two years, inadequate for a consumer discretionary business. Its large expense base and inefficient cost structure were the main culprits behind this performance.
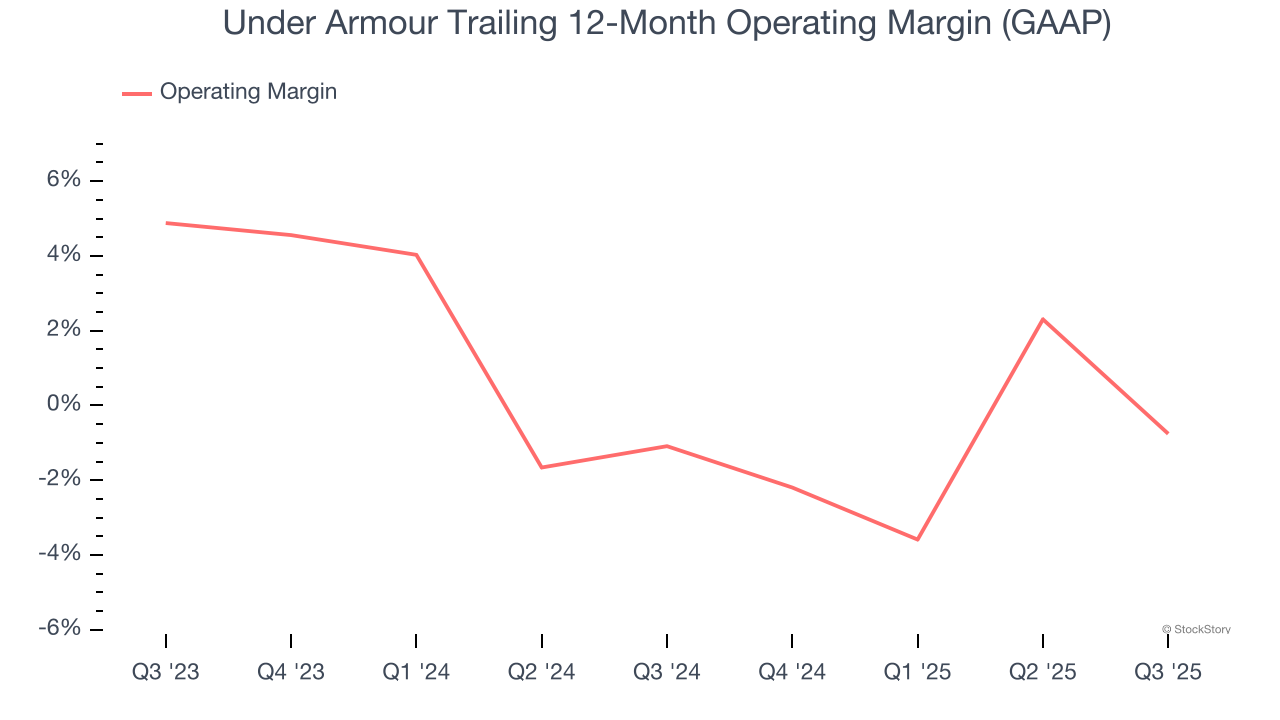
This quarter, Under Armour generated an operating margin profit margin of 1.3%, down 11.1 percentage points year on year. This contraction shows it was less efficient because its expenses increased relative to its revenue.
Earnings Per Share
Revenue trends explain a company’s historical growth, but the long-term change in earnings per share (EPS) points to the profitability of that growth – for example, a company could inflate its sales through excessive spending on advertising and promotions.
Under Armour’s full-year EPS flipped from negative to positive over the last five years. This is encouraging and shows it’s at a critical moment in its life.
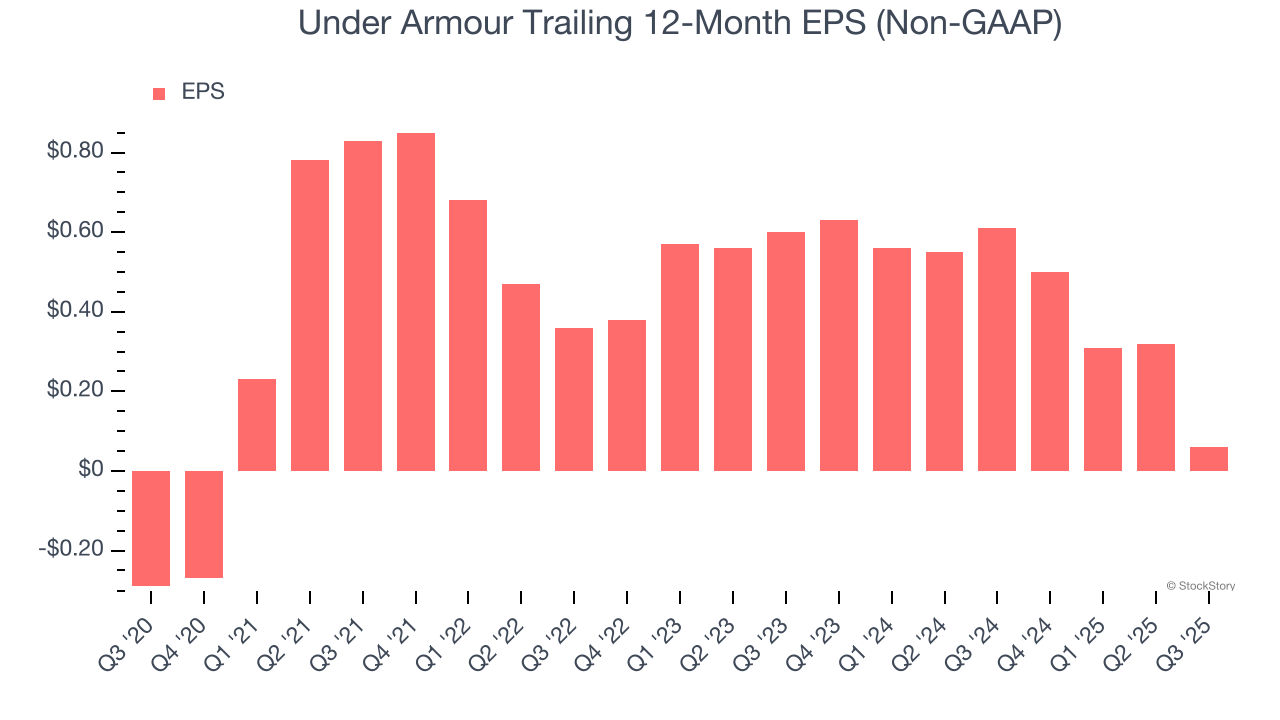
In Q3, Under Armour reported adjusted EPS of $0.04, down from $0.30 in the same quarter last year. Despite falling year on year, this print easily cleared analysts’ estimates. Over the next 12 months, Wall Street expects Under Armour’s full-year EPS of $0.06 to grow 165%.
Key Takeaways from Under Armour’s Q3 Results
It was good to see Under Armour beat analysts’ EPS expectations this quarter. We were also glad its constant currency revenue outperformed Wall Street’s estimates. On the other hand, its full-year EPS guidance missed and its EBITDA fell short of Wall Street’s estimates. Overall, this was a weaker quarter. The stock remained flat at $4.60 immediately following the results.
Big picture, is Under Armour a buy here and now? When making that decision, it’s important to consider its valuation, business qualities, as well as what has happened in the latest quarter. We cover that in our actionable full research report which you can read here, it’s free for active Edge members.


