- Subscription revenue of $286 million, up 19% year over year
- Confluent Cloud revenue of $161 million, up 24% year over year
- 1,487 customers with $100,000 or greater in ARR, up 10% year over year
Confluent, Inc. (NASDAQ: CFLT), the data streaming pioneer, today announced financial results for its third quarter of 2025, ended September 30, 2025.
This press release features multimedia. View the full release here: https://www.businesswire.com/news/home/20251026938479/en/
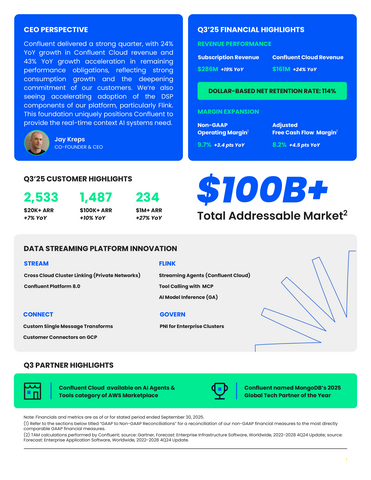
“Confluent delivered a strong quarter, with 24% year-over-year growth in Confluent Cloud revenue and 43% year-over-year growth acceleration in remaining performance obligations, reflecting strong consumption growth and the deepening commitment of our customers,” said Jay Kreps, co-founder and CEO, Confluent. “We’re also seeing accelerating adoption of the DSP components of our platform, particularly Flink. This foundation uniquely positions Confluent to provide the real-time context AI systems need.”
“Our strong third-quarter performance highlights the momentum of our data streaming platform and our diversified growth strategy,” said Rohan Sivaram, CFO, Confluent. “Our robust top-line growth, stabilized dollar-based net retention rate, and continued margin expansion are a testament to our ability to drive durable, profitable growth over the long term.”
Third Quarter 2025 Financial Highlights (In millions, except per share data and percentages) |
|||
|
Q3 2025 |
Q3 2024 |
Y/Y Change |
Subscription Revenue |
$286.3 |
$239.9 |
19% |
Total Revenue |
$298.5 |
$250.2 |
19% |
GAAP Operating Loss |
$(83.3) |
$(93.7) |
$10.4 |
Non-GAAP Operating Income |
$29.1 |
$15.8 |
$13.3 |
GAAP Operating Margin |
(27.9%) |
(37.4%) |
9.5 pts |
Non-GAAP Operating Margin |
9.7% |
6.3% |
3.4 pts |
GAAP Net Loss Per Share |
$(0.19) |
$(0.23) |
$0.04 |
Non-GAAP Net Income Per Diluted Share |
$0.13 |
$0.10 |
$0.03 |
Net Cash Provided by Operating Activities |
$30.8 |
$15.6 |
$15.2 |
Adjusted Free Cash Flow |
$24.6 |
$9.3 |
$15.3 |
Financial Outlook
For the fourth quarter and fiscal year 2025, Confluent expects:
|
Q4 2025 Outlook |
FY 2025 Outlook |
Subscription Revenue |
$295.5-$296.5 million |
$1,113.5-$1,114.5 million |
Non-GAAP Operating Margin |
~7% |
~7% |
Non-GAAP Net Income Per Diluted Share |
$0.09-$0.10 |
$0.39-$0.40 |
A reconciliation of forward-looking non-GAAP operating margin, adjusted free cash flow margin, free cash flow margin and non-GAAP net income per diluted share to the most directly comparable GAAP measures is not available without unreasonable effort, as certain items cannot be reasonably predicted because of their high variability, complexity and low visibility. In particular, the measures and effects of our stock-based compensation-related charges, which include stock-based compensation expenses, employer payroll taxes on employee stock transactions, and amortization of stock-based compensation capitalized in internal-use software, are directly impacted by the timing of employee stock transactions and unpredictable fluctuations in our stock price, which we expect to have a significant impact on our future GAAP financial results.
Conference Call Information
Confluent will host a video webcast to discuss the company’s third quarter 2025 results as well as its financial outlook today at 4:30 p.m. Eastern Time/1:30 p.m. Pacific Time. Open to the public, investors may access the webcast, earnings press release, supplemental financial information, and investor presentation on Confluent’s investor relations website at investors.confluent.io before the commencement of the webcast. A replay of the webcast will also be accessible from Confluent’s investor relations website a few hours after the conclusion of the live event.
Confluent uses its investor relations website and may use its X (Twitter), LinkedIn, and Facebook accounts as a means of disclosing material non-public information and for complying with its disclosure obligations under Regulation FD.
Forward-Looking Statements
This press release and the earnings call referencing this press release contain forward-looking statements including, among other things, statements regarding (i) our financial outlook, including expected subscription revenue, Confluent Cloud revenue, non-GAAP operating margin, free cash flow margin, adjusted free cash flow margin, non-GAAP net income per share, revenue mix, revenue run rates, Confluent Cloud and data streaming platform growth, adoption and traction, operating margins and margin improvements, targeted or anticipated gross and operating margin levels, earnings per share levels and improvements, in-product optimizations of Confluent Cloud, continued business momentum, and expected revenue, (ii) our market and category leadership position, (iii) our expectations and trends relating to growth of our Data Streaming Platform products, (iv) rates of Confluent Cloud consumption, Confluent Platform growth, and demand for and retention of data streaming platforms like Confluent, (v) customer growth, retention and engagement, and expansion of customers into new use cases, (vi) increased adoption of our offerings and fully managed solutions for data streaming in general, including from customers building generative AI applications, (vii) our expectations regarding the impact of operational improvements, including our sales and go-to-market strategies, (viii) growth in and growth rate of revenue, customers, dollar-based net retention rate, and gross retention rate, (ix) our ability to increase engagement of customers for Confluent and expand customer cohorts, (x) our market opportunity and our ability to capture our market opportunity, (xi) our go-to-market strategy, (xii) our product differentiation and market acceptance of our products, (xiii) our strategy and expected results and market acceptance for our offerings, (xiv) our expectations of meeting near-term and mid-term financial targets, (xv) our expectations regarding the generative AI landscape and our offerings, (xvi) our ability to drive long-term growth, (xvii) our expectations regarding the impact of our offerings, including WarpStream and Freight Clusters, (xviii) our expectations regarding our growth strategies and our partner ecosystem, and (xix) our overall future prospects. The words “believe,” “may,” “will,” “estimate,” “continue,” “anticipate,” “intend,” “expect,” “seek,” “plan,” “project,” “target,” “looking ahead,” “look to,” “move into,” and similar expressions are intended to identify forward-looking statements. Forward-looking statements represent our current beliefs, estimates and assumptions only as of the date of this press release and information contained in this press release should not be relied upon as representing our estimates as of any subsequent date. These forward-looking statements are subject to risks, uncertainties, and assumptions. If the risks materialize or assumptions prove incorrect, actual results could differ materially from the results implied by these forward-looking statements. Risks include, but are not limited to: (i) our limited operating history, including in uncertain macroeconomic environments, (ii) our ability to sustain and manage our rapid growth, (iii) our ability to increase consumption of our offerings, including by existing customers and through the acquisition of new customers, including by addressing customer consumption preferences, successfully adding new features and functionality to our offerings, and partnering with our customers to help them realize increased value in Confluent in an efficient and sustainable manner, (iv) our ability to successfully execute our go-to-market strategy and initiatives, (v) our ability to attract new customers and successfully ramp their consumption of our offerings, as well as retain and sell additional features and services to our existing customers, (vi) uncertain macroeconomic conditions, including high inflation, high interest rates, bank failures, global tariffs, taxes on multinational companies, geopolitical events, recessionary risks, and exchange rate fluctuations, (vii) the estimated addressable market opportunity for our Data Streaming Platform, and our ability to capture our share of that market opportunity, (viii) shifts in certain customers’ data streaming strategies, (ix) our ability to compete effectively in an increasingly competitive market, (x) our ability to attract, ramp, and retain highly qualified personnel, and the impacts of attrition and related challenges, (xi) breaches in our security measures, intentional or accidental cybersecurity incidents or unauthorized access to our platform, our data, or our customers’ or other users’ personal data, (xii) our reliance on third-party cloud-based infrastructure to host Confluent Cloud, (xiii) public sector budgetary cycles and funding reductions or delays, or shifts in procurement strategies, (xiv) changes in legislation related to the taxation of business entities, and (xv) our ability to accurately forecast our future performance, business and growth. These risks are not exhaustive. Further information on these and other risks that could affect Confluent’s results is included in our filings with the Securities and Exchange Commission (“SEC”), including our Quarterly Report on Form 10-Q for the quarter ended June 30, 2025, and our future reports that we may file from time to time with the SEC. Additional information will be made available in our Quarterly Report on Form 10-Q for the quarter ended September 30, 2025 that will be filed with the SEC, which should be read in conjunction with this press release and the financial results included herein. Confluent assumes no obligation to, and does not currently intend to, update or revise any forward-looking statements, whether as a result of new information, future events or otherwise, except as required by law.
Non-GAAP Financial Measures
This press release includes the following non-GAAP financial measures: non-GAAP gross profit, non-GAAP gross margin, non-GAAP operating expenses (research and development, sales and marketing, and general and administrative), non-GAAP operating income, non-GAAP operating margin, non-GAAP net income, non-GAAP net income per share, free cash flow, free cash flow margin, adjusted free cash flow, and adjusted free cash flow margin. We use these non-GAAP financial measures and other key metrics internally to facilitate analysis of our financial and business trends and for internal planning and forecasting purposes. We believe these non-GAAP financial measures, when taken collectively, may be helpful to investors because they provide consistency and comparability with past financial performance by excluding certain items that may not be indicative of our business, results of operations, or outlook. However, non-GAAP financial measures have limitations as an analytical tool and are presented for supplemental informational purposes only. They should not be considered in isolation from, or as a substitute for, financial information prepared in accordance with GAAP. In particular, other companies, including companies in our industry, may report non-GAAP gross profit, non-GAAP gross margin, non-GAAP operating expenses (research and development, sales and marketing, general and administrative), non-GAAP operating income, non-GAAP operating margin, non-GAAP net income, non-GAAP net income per share, free cash flow, free cash flow margin, adjusted free cash flow, adjusted free cash flow margin, or similarly titled measures but calculate them differently, which reduces their usefulness as comparative measures. Further, free cash flow and adjusted free cash flow are not substitutes for cash used in operating activities. The utility of free cash flow and adjusted free cash flow are limited as such measures do not reflect our future contractual commitments and do not represent the total increase or decrease in our cash balance for any given period. Investors are encouraged to review the reconciliation of these non-GAAP measures to their most directly comparable GAAP financial measures, as presented below.
We define non-GAAP gross profit, non-GAAP gross margin, non-GAAP operating expenses (research and development, sales and marketing, and general and administrative), non-GAAP operating income, non-GAAP operating margin, non-GAAP net income, and non-GAAP net income per share as the respective GAAP measures, adjusted for, as applicable, stock-based compensation-related charges which include stock-based compensation expense, employer taxes on employee stock transactions and amortization of stock-based compensation capitalized in internal-use software; amortization of acquired intangibles; acquisition-related expenses; amortization of debt issuance costs; and income tax effects associated with these adjustments as well as the non-recurring income tax expense or benefit associated with acquisitions and income tax benefit from the release of a valuation allowance on certain deferred tax assets. Non-GAAP gross margin and non-GAAP operating margin are defined as non-GAAP gross profit and non-GAAP operating income as a percentage of revenue, respectively.
We define free cash flow as net cash provided by (used in) operating activities less capitalized internal-use software costs and capital expenditures and free cash flow margin as free cash flow as a percentage of revenue. We define adjusted free cash flow as free cash flow excluding the non-recurring impact from a change to timing of certain cash compensation payments and adjusted free cash flow margin as adjusted free cash flow as a percentage of revenue. We believe that free cash flow, free cash flow margin, adjusted free cash flow, and adjusted free cash flow margin are useful indicators of liquidity that provide information to management and investors about the performance of core operations and future ability to generate cash that can be used for strategic opportunities or investing in our business.
Definition
Customers with $100,000 or greater in annual recurring revenue (“ARR”) represent the number of customers that contributed $100,000 or more in ARR as of period end. We define ARR as (1) with respect to Confluent Platform customers, the amount of revenue to which our customers are contractually committed over the following 12 months assuming no increases or reductions in their subscriptions, and (2) with respect to Confluent Cloud and WarpStream customers, the amount of revenue that we expect to recognize from such customers over the following 12 months, calculated by annualizing actual consumption of Confluent Cloud and WarpStream in the last three months of the applicable period, assuming no increases or reductions in usage rate. Services arrangements are excluded from the calculation of ARR. For purposes of determining our customer count, we treat all affiliated entities with the same parent organization as a single customer and include pay-as-you-go customers. Our customer count is subject to adjustments for acquisitions, consolidations, spin-offs, and other market activity.
About Confluent
Confluent is the data streaming platform that is pioneering a fundamentally new category of data infrastructure that sets data in motion. Confluent’s cloud-native offering is the foundational platform for data in motion – designed to be the intelligent connective tissue enabling real-time data, from multiple sources, to constantly stream across the organization. With Confluent, organizations can meet the new business imperative of delivering rich, digital front-end customer experiences and transitioning to sophisticated, real-time, software-driven backend operations.
Confluent, Inc. Condensed Consolidated Balance Sheets (in thousands) (unaudited) |
|||||||
September 30, 2025 |
December 31, 2024 |
||||||
| ASSETS | |||||||
| Current assets: | |||||||
| Cash and cash equivalents | $ |
298,537 |
|
$ |
385,980 |
|
|
| Marketable securities |
|
1,691,241 |
|
|
1,524,583 |
|
|
| Accounts receivable, net |
|
356,397 |
|
|
314,306 |
|
|
| Deferred contract acquisition costs |
|
49,814 |
|
|
47,271 |
|
|
| Prepaid expenses and other current assets |
|
102,869 |
|
|
79,179 |
|
|
| Total current assets |
|
2,498,858 |
|
|
2,351,319 |
|
|
| Property and equipment, net |
|
89,260 |
|
|
78,680 |
|
|
| Operating lease right-of-use assets |
|
5,791 |
|
|
8,818 |
|
|
| Goodwill |
|
164,406 |
|
|
164,406 |
|
|
| Intangible assets, net |
|
6,525 |
|
|
7,924 |
|
|
| Deferred contract acquisition costs, non-current |
|
70,548 |
|
|
71,468 |
|
|
| Other assets, non-current |
|
41,717 |
|
|
12,296 |
|
|
| Total assets | $ |
2,877,105 |
|
$ |
2,694,911 |
|
|
| LIABILITIES AND STOCKHOLDERS’ EQUITY | |||||||
| Current liabilities: | |||||||
| Accounts payable | $ |
11,765 |
|
$ |
7,531 |
|
|
| Accrued expenses and other liabilities |
|
154,441 |
|
|
194,250 |
|
|
| Operating lease liabilities |
|
9,393 |
|
|
8,694 |
|
|
| Deferred revenue |
|
447,012 |
|
|
378,771 |
|
|
| Total current liabilities |
|
622,611 |
|
|
589,246 |
|
|
| Operating lease liabilities, non-current |
|
2,064 |
|
|
9,138 |
|
|
| Deferred revenue, non-current |
|
28,251 |
|
|
30,430 |
|
|
| Convertible senior notes, net |
|
1,095,019 |
|
|
1,092,149 |
|
|
| Other liabilities, non-current |
|
10,210 |
|
|
12,722 |
|
|
| Total liabilities |
|
1,758,155 |
|
|
1,733,685 |
|
|
| Stockholders’ equity: | |||||||
| Preferred stock |
|
— |
|
|
— |
|
|
| Class A common stock |
|
3 |
|
|
2 |
|
|
| Class B common stock |
|
1 |
|
|
1 |
|
|
| Additional paid-in capital |
|
3,317,956 |
|
|
2,953,080 |
|
|
| Accumulated other comprehensive income (loss) |
|
6,234 |
|
|
(2,641 |
) |
|
| Accumulated deficit |
|
(2,205,244 |
) |
|
(1,989,216 |
) |
|
| Total stockholders’ equity |
|
1,118,950 |
|
|
961,226 |
|
|
| Total liabilities and stockholders’ equity | $ |
2,877,105 |
|
$ |
2,694,911 |
|
|
Confluent, Inc. Condensed Consolidated Statements of Operations (in thousands, except share and per share data) (unaudited) |
|||||||||||||||
| Three Months Ended September 30, | Nine Months Ended September 30, | ||||||||||||||
|
|
2025 |
|
|
|
2024 |
|
|
|
2025 |
|
|
|
2024 |
|
| Revenue: | |||||||||||||||
| Subscription | $ |
286,337 |
|
$ |
239,851 |
|
$ |
818,079 |
|
$ |
671,455 |
|
|||
| Services |
|
12,187 |
|
|
10,348 |
|
|
33,850 |
|
|
30,967 |
|
|||
| Total revenue |
|
298,524 |
|
|
250,199 |
|
|
851,929 |
|
|
702,422 |
|
|||
| Cost of revenue: | |||||||||||||||
| Subscription(1) |
|
62,033 |
|
|
52,162 |
|
|
179,932 |
|
|
153,380 |
|
|||
| Services(1) |
|
14,926 |
|
|
11,541 |
|
|
40,315 |
|
|
36,525 |
|
|||
| Total cost of revenue |
|
76,959 |
|
|
63,703 |
|
|
220,247 |
|
|
189,905 |
|
|||
| Gross profit |
|
221,565 |
|
|
186,496 |
|
|
631,682 |
|
|
512,517 |
|
|||
| Operating expenses: | |||||||||||||||
| Research and development(1) |
|
121,758 |
|
|
102,720 |
|
|
359,780 |
|
|
306,351 |
|
|||
| Sales and marketing(1) |
|
142,822 |
|
|
137,968 |
|
|
432,712 |
|
|
402,185 |
|
|||
| General and administrative(1) |
|
40,297 |
|
|
39,471 |
|
|
120,118 |
|
|
117,344 |
|
|||
| Total operating expenses |
|
304,877 |
|
|
280,159 |
|
|
912,610 |
|
|
825,880 |
|
|||
| Operating loss |
|
(83,312 |
) |
|
(93,663 |
) |
|
(280,928 |
) |
|
(313,363 |
) |
|||
| Other income, net |
|
18,361 |
|
|
22,495 |
|
|
59,880 |
|
|
65,198 |
|
|||
| Loss before income taxes |
|
(64,951 |
) |
|
(71,168 |
) |
|
(221,048 |
) |
|
(248,165 |
) |
|||
| Provision for (benefit from) income taxes |
|
1,553 |
|
|
2,976 |
|
|
(5,020 |
) |
|
8,846 |
|
|||
| Net loss | $ |
(66,504 |
) |
$ |
(74,144 |
) |
$ |
(216,028 |
) |
$ |
(257,011 |
) |
|||
| Net loss per share, basic and diluted | $ |
(0.19 |
) |
$ |
(0.23 |
) |
$ |
(0.63 |
) |
$ |
(0.80 |
) |
|||
| Weighted-average shares used to compute net loss per share, basic and diluted |
|
346,197,913 |
|
|
324,317,971 |
|
|
341,085,546 |
|
|
319,330,398 |
|
|||
(1) Includes stock-based compensation-related charges as follows: |
|||||||||||||||
| Three Months Ended September 30, | Nine Months Ended September 30, | ||||||||||||||
|
|
2025 |
|
|
|
2024 |
|
|
|
2025 |
|
|
|
2024 |
|
| Cost of revenue - subscription | $ |
9,552 |
$ |
8,999 |
$ |
28,642 |
$ |
26,196 |
|||||||
| Cost of revenue - services |
|
1,758 |
|
|
2,341 |
|
|
5,647 |
|
|
7,397 |
|
|||
| Research and development |
|
50,165 |
|
|
42,259 |
|
|
142,653 |
|
|
125,549 |
|
|||
| Sales and marketing |
|
32,353 |
|
|
33,639 |
|
|
97,178 |
|
|
104,751 |
|
|||
| General and administrative |
|
13,004 |
|
|
14,599 |
|
|
41,210 |
|
|
45,629 |
|
|||
| Total stock-based compensation-related charges | $ |
106,832 |
|
$ |
101,837 |
|
$ |
315,330 |
|
$ |
309,522 |
|
|||
Confluent, Inc. Condensed Consolidated Statements of Cash Flows (in thousands) (unaudited) |
|||||||||||||||
| Three Months Ended September 30, | Nine Months Ended September 30, | ||||||||||||||
|
|
2025 |
|
|
|
2024 |
|
|
|
2025 |
|
|
|
2024 |
|
| CASH FLOWS FROM OPERATING ACTIVITIES | |||||||||||||||
| Net loss | $ |
(66,504 |
) |
$ |
(74,144 |
) |
$ |
(216,028 |
) |
$ |
(257,011 |
) |
|||
| Adjustments to reconcile net loss to cash provided by (used in) operating activities: | |||||||||||||||
| Depreciation and amortization |
|
7,821 |
|
|
5,702 |
|
|
21,770 |
|
|
15,855 |
|
|||
| Net accretion of discounts on marketable securities |
|
(5,060 |
) |
|
(9,294 |
) |
|
(17,859 |
) |
|
(29,561 |
) |
|||
| Amortization of debt issuance costs |
|
968 |
|
|
964 |
|
|
2,870 |
|
|
2,870 |
|
|||
| Amortization of deferred contract acquisition costs |
|
15,208 |
|
|
13,949 |
|
|
43,462 |
|
|
40,045 |
|
|||
| Non-cash operating lease costs |
|
1,046 |
|
|
940 |
|
|
3,210 |
|
|
2,794 |
|
|||
| Stock-based compensation, net of amounts capitalized |
|
101,128 |
|
|
98,307 |
|
|
295,700 |
|
|
292,736 |
|
|||
| Deferred income taxes |
|
310 |
|
|
(111 |
) |
|
(16,851 |
) |
|
231 |
|
|||
| Other |
|
3,025 |
|
|
485 |
|
|
4,586 |
|
|
1,695 |
|
|||
| Changes in operating assets and liabilities, net of effects of business combinations: | |||||||||||||||
| Accounts receivable |
|
291 |
|
|
(21,577 |
) |
|
(44,616 |
) |
|
(50,235 |
) |
|||
| Deferred contract acquisition costs |
|
(19,439 |
) |
|
(12,244 |
) |
|
(45,085 |
) |
|
(37,272 |
) |
|||
| Prepaid expenses and other assets |
|
(11,213 |
) |
|
(2,135 |
) |
|
(29,686 |
) |
|
(361 |
) |
|||
| Accounts payable |
|
491 |
|
|
1,231 |
|
|
4,573 |
|
|
8,286 |
|
|||
| Accrued expenses and other liabilities |
|
(14,694 |
) |
|
(10,363 |
) |
|
(43,373 |
) |
|
(7,222 |
) |
|||
| Operating lease liabilities |
|
(2,191 |
) |
|
(2,020 |
) |
|
(6,573 |
) |
|
(5,949 |
) |
|||
| Deferred revenue |
|
19,614 |
|
|
25,923 |
|
|
66,062 |
|
|
21,348 |
|
|||
| Net cash provided by (used in) operating activities |
|
30,801 |
|
|
15,613 |
|
|
22,162 |
|
|
(1,751 |
) |
|||
| CASH FLOWS FROM INVESTING ACTIVITIES | |||||||||||||||
| Capitalization of internal-use software costs |
|
(5,409 |
) |
|
(5,669 |
) |
|
(16,406 |
) |
|
(15,984 |
) |
|||
| Purchases of marketable securities |
|
(414,962 |
) |
|
(273,169 |
) |
|
(1,286,190 |
) |
|
(1,172,359 |
) |
|||
| Sales of marketable securities |
|
— |
|
|
— |
|
|
6,144 |
|
|
12,744 |
|
|||
| Maturities of marketable securities |
|
375,177 |
|
|
374,281 |
|
|
1,133,114 |
|
|
1,210,037 |
|
|||
| Purchases of investments in privately-held companies |
|
(750 |
) |
|
(1,250 |
) |
|
(750 |
) |
|
(2,250 |
) |
|||
| Purchases of property and equipment |
|
(807 |
) |
|
(607 |
) |
|
(3,155 |
) |
|
(1,898 |
) |
|||
| Cash paid for business combinations, net of cash acquired |
|
— |
|
|
(115,516 |
) |
|
— |
|
|
(115,516 |
) |
|||
| Net cash used in investing activities |
|
(46,751 |
) |
|
(21,930 |
) |
|
(167,243 |
) |
|
(85,226 |
) |
|||
| CASH FLOWS FROM FINANCING ACTIVITIES | |||||||||||||||
| Proceeds from issuance of common stock upon exercise of vested options |
|
10,041 |
|
|
8,835 |
|
|
32,709 |
|
|
36,332 |
|
|||
| Proceeds from issuance of common stock under employee stock purchase plan |
|
9,731 |
|
|
8,367 |
|
|
23,926 |
|
|
23,970 |
|
|||
| Net cash provided by financing activities |
|
19,772 |
|
|
17,202 |
|
|
56,635 |
|
|
60,302 |
|
|||
| Effect of exchange rate changes on cash and cash equivalents |
|
(876 |
) |
|
393 |
|
|
1,003 |
|
|
(480 |
) |
|||
| Net increase (decrease) in cash and cash equivalents |
|
2,946 |
|
|
11,278 |
|
|
(87,443 |
) |
|
(27,155 |
) |
|||
| Cash and cash equivalents at beginning of period |
|
295,591 |
|
|
311,328 |
|
|
385,980 |
|
|
349,761 |
|
|||
| Cash and cash equivalents at end of period | $ |
298,537 |
|
$ |
322,606 |
|
$ |
298,537 |
|
$ |
322,606 |
|
|||
Confluent, Inc. Reconciliation of GAAP Measures to Non-GAAP Measures (in thousands, except percentages, share and per share data) (unaudited) |
|||||||||||||||
| Three Months Ended September 30, | Nine Months Ended September 30, | ||||||||||||||
|
|
2025 |
|
|
|
2024 |
|
|
|
2025 |
|
|
|
2024 |
|
| Reconciliation of GAAP total gross profit to non-GAAP total gross profit: | |||||||||||||||
| Total gross profit on a GAAP basis | $ |
221,565 |
|
$ |
186,496 |
|
$ |
631,682 |
|
$ |
512,517 |
|
|||
| Total gross margin on a GAAP basis |
|
74.2 |
% |
|
74.5 |
% |
|
74.1 |
% |
|
73.0 |
% |
|||
| Add: Stock-based compensation-related charges |
|
11,310 |
|
|
11,340 |
|
|
34,289 |
|
|
33,593 |
|
|||
| Add: Amortization of acquired intangibles |
|
472 |
|
|
585 |
|
|
1,399 |
|
|
1,588 |
|
|||
| Non-GAAP total gross profit | $ |
233,347 |
|
$ |
198,421 |
|
$ |
667,370 |
|
$ |
547,698 |
|
|||
| Non-GAAP total gross margin |
|
78.2 |
% |
|
79.3 |
% |
|
78.3 |
% |
|
78.0 |
% |
|||
| Reconciliation of GAAP operating expenses to non-GAAP operating expenses: | |||||||||||||||
| Research and development operating expense on a GAAP basis | $ |
121,758 |
|
$ |
102,720 |
|
$ |
359,780 |
|
$ |
306,351 |
|
|||
| Research and development operating expense as a percentage of total revenue on a GAAP basis |
|
40.8 |
% |
|
41.1 |
% |
|
42.2 |
% |
|
43.6 |
% |
|||
| Less: Stock-based compensation-related charges |
|
50,165 |
|
|
42,259 |
|
|
142,653 |
|
|
125,549 |
|
|||
| Less: Acquisition-related expenses |
|
5,076 |
|
|
5,870 |
|
|
22,682 |
|
|
14,704 |
|
|||
| Non-GAAP research and development operating expense | $ |
66,517 |
|
$ |
54,591 |
|
$ |
194,445 |
|
$ |
166,098 |
|
|||
| Non-GAAP research and development operating expense as a percentage of total revenue |
|
22.3 |
% |
|
21.8 |
% |
|
22.8 |
% |
|
23.6 |
% |
|||
| Sales and marketing operating expense on a GAAP basis | $ |
142,822 |
|
$ |
137,968 |
|
$ |
432,712 |
|
$ |
402,185 |
|
|||
| Sales and marketing operating expense as a percentage of total revenue on a GAAP basis |
|
47.8 |
% |
|
55.1 |
% |
|
50.8 |
% |
|
57.3 |
% |
|||
| Less: Stock-based compensation-related charges |
|
32,353 |
|
|
33,639 |
|
|
97,178 |
|
|
104,751 |
|
|||
| Non-GAAP sales and marketing operating expense | $ |
110,469 |
|
$ |
104,329 |
|
$ |
335,534 |
|
$ |
297,434 |
|
|||
| Non-GAAP sales and marketing operating expense as a percentage of total revenue |
|
37.0 |
% |
|
41.7 |
% |
|
39.4 |
% |
|
42.3 |
% |
|||
| General and administrative operating expense on a GAAP basis | $ |
40,297 |
|
$ |
39,471 |
|
$ |
120,118 |
|
$ |
117,344 |
|
|||
| General and administrative operating expense as a percentage of total revenue on a GAAP basis |
|
13.5 |
% |
|
15.8 |
% |
|
14.1 |
% |
|
16.7 |
% |
|||
| Less: Stock-based compensation-related charges |
|
13,004 |
|
|
14,599 |
|
|
41,210 |
|
|
45,629 |
|
|||
| Less: Acquisition-related expenses |
|
— |
|
|
1,169 |
|
|
14 |
|
|
1,400 |
|
|||
| Non-GAAP general and administrative operating expense | $ |
27,293 |
|
$ |
23,703 |
|
$ |
78,894 |
|
$ |
70,315 |
|
|||
| Non-GAAP general and administrative operating expense as a percentage of total revenue |
|
9.1 |
% |
|
9.5 |
% |
|
9.3 |
% |
|
10.0 |
% |
|||
| Three Months Ended September 30, | Nine Months Ended September 30, | ||||||||||||||
|
|
2025 |
|
|
|
2024 |
|
|
|
2025 |
|
|
|
2024 |
|
| Reconciliation of GAAP operating loss to non-GAAP operating income: | |||||||||||||||
| Operating loss on a GAAP basis | $ |
(83,312 |
) |
$ |
(93,663 |
) |
$ |
(280,928 |
) |
$ |
(313,363 |
) |
|||
| GAAP operating margin |
|
(27.9 |
%) |
|
(37.4 |
%) |
|
(33.0 |
%) |
|
(44.6 |
%) |
|||
| Add: Stock-based compensation-related charges |
|
106,832 |
|
|
101,837 |
|
|
315,330 |
|
|
309,522 |
|
|||
| Add: Amortization of acquired intangibles |
|
472 |
|
|
585 |
|
|
1,399 |
|
|
1,588 |
|
|||
| Add: Acquisition-related expenses |
|
5,076 |
|
|
7,039 |
|
|
22,696 |
|
|
16,104 |
|
|||
| Non-GAAP operating income | $ |
29,068 |
|
$ |
15,798 |
|
$ |
58,497 |
|
$ |
13,851 |
|
|||
| Non-GAAP operating margin |
|
9.7 |
% |
|
6.3 |
% |
|
6.9 |
% |
|
2.0 |
% |
|||
| Reconciliation of GAAP net loss to non-GAAP net income: | |||||||||||||||
| Net loss on a GAAP basis | $ |
(66,504 |
) |
$ |
(74,144 |
) |
$ |
(216,028 |
) |
$ |
(257,011 |
) |
|||
| Add: Stock-based compensation-related charges |
|
106,832 |
|
|
101,837 |
|
|
315,330 |
|
|
309,522 |
|
|||
| Add: Amortization of acquired intangibles |
|
472 |
|
|
585 |
|
|
1,399 |
|
|
1,588 |
|
|||
| Add: Acquisition-related expenses |
|
5,076 |
|
|
7,039 |
|
|
22,696 |
|
|
16,104 |
|
|||
| Add: Amortization of debt issuance costs |
|
968 |
|
|
964 |
|
|
2,870 |
|
|
2,870 |
|
|||
| Add: Income tax effects and adjustments(1) |
|
604 |
|
|
(1,529 |
) |
|
(15,571 |
) |
|
(1,964 |
) |
|||
| Non-GAAP net income | $ |
47,448 |
|
$ |
34,752 |
|
$ |
110,696 |
|
$ |
71,109 |
|
|||
| Non-GAAP net income per share, basic | $ |
0.14 |
|
$ |
0.11 |
|
$ |
0.32 |
|
$ |
0.22 |
|
|||
| Non-GAAP net income per share, diluted | $ |
0.13 |
|
$ |
0.10 |
|
$ |
0.30 |
|
$ |
0.20 |
|
|||
| Weighted-average shares used to compute non-GAAP net income per share, basic |
|
346,197,913 |
|
|
324,317,971 |
|
|
341,085,546 |
|
|
319,330,398 |
|
|||
| Weighted-average shares used to compute non-GAAP net income per share, diluted |
|
370,632,077 |
|
|
353,577,179 |
|
|
368,607,401 |
|
|
352,685,531 |
|
|||
(1) |
|
Income tax effects and adjustments for the nine months ended September 30, 2025 includes an adjustment for the income tax benefit from the release of a valuation allowance on certain deferred tax assets. |
The following table presents a reconciliation of free cash flow and adjusted free cash flow to net cash provided by (used in) operating activities, the most directly comparable GAAP measure, as well as free cash flow margin and adjusted free cash flow margin to net cash provided by (used in) operating activities as a percentage of total revenue, the most directly comparable GAAP measure, for each of the periods indicated (unaudited, in thousands, except percentages):
| Three Months Ended September 30, | Nine Months Ended September 30, | ||||||||||||||
|
|
2025 |
|
|
|
2024 |
|
|
|
2025 |
|
|
|
2024 |
|
| Net cash provided by (used in) operating activities | $ |
30,801 |
|
$ |
15,613 |
|
$ |
22,162 |
|
$ |
(1,751 |
) |
|||
| Capitalized internal-use software costs |
|
(5,409 |
) |
|
(5,669 |
) |
|
(16,406 |
) |
|
(15,984 |
) |
|||
| Capital expenditures |
|
(807 |
) |
|
(607 |
) |
|
(3,155 |
) |
|
(1,898 |
) |
|||
| Free cash flow | $ |
24,585 |
|
$ |
9,337 |
|
$ |
2,601 |
|
$ |
(19,633 |
) |
|||
| Impact from compensation payments adjustment(1) |
|
— |
|
|
— |
|
|
37,930 |
|
|
— |
|
|||
| Adjusted free cash flow | $ |
24,585 |
|
$ |
9,337 |
|
$ |
40,531 |
|
$ |
(19,633 |
) |
|||
| Net cash provided by (used in) operating activities as a percentage of total revenue |
|
10.3 |
% |
|
6.2 |
% |
|
2.6 |
% |
|
(0.2 |
%) |
|||
| Free cash flow margin |
|
8.2 |
% |
|
3.7 |
% |
|
0.3 |
% |
|
(2.8 |
%) |
|||
| Adjusted free cash flow margin |
|
8.2 |
% |
|
3.7 |
% |
|
4.8 |
% |
|
(2.8 |
%) |
|||
| Net cash used in investing activities | $ |
(46,751 |
) |
$ |
(21,930 |
) |
$ |
(167,243 |
) |
$ |
(85,226 |
) |
|||
| Net cash provided by financing activities | $ |
19,772 |
|
$ |
17,202 |
|
$ |
56,635 |
|
$ |
60,302 |
|
|||
(1) |
|
Represents an adjustment to reflect the non-recurring impact in the first quarter of 2025 from the change to timing of cash compensation payments for most of our non go-to-market employees implemented at the start of 2025. |
View source version on businesswire.com: https://www.businesswire.com/news/home/20251026938479/en/
Contacts
Investor Contact
Shane Xie
investors@confluent.io
Media Contact
Justin Dorff
pr@confluent.io