- Fourth quarter net income of $813 million with cash flow from operating activities of $1,632 million and free cash flow¹ of $1,233 million
- Highest annual Upstream production in over 30 years, underpinned by record annual Kearl production and continued strong production performance at Cold Lake
- Continued fuel demand recovery with full-year Downstream refinery capacity utilization of 89 percent
- Highest full-year Chemical earnings in over 30 years
- Record shareholder returns of nearly $3 billion in 2021 through dividend payments and share repurchases under the company’s normal course issuer bid program
- Quarterly dividend increased by 26 percent from 27 cents to 34 cents per share
- Announced plans for 2030 oil sands greenhouse gas emission intensity reduction in support of its goal to achieve net zero emissions in its operated oil sands assets by 2050
Imperial Oil Limited (TSE: IMO, NYSE American: IMO):
This press release features multimedia. View the full release here: https://www.businesswire.com/news/home/20220201005385/en/
Upstream fourth quarter net income (loss) factor analysis (Graphic: Business Wire)
|
|
|
|
|
|
|
|
|
|
|||||||
|
|
|
Fourth quarter |
|
Twelve months |
|||||||||||
millions of Canadian dollars, unless noted |
2021 |
2020 |
∆ |
|
2021 |
2020 |
∆ |
|||||||||
Net income (loss) (U.S. GAAP) |
813 |
(1,146) |
+1,959 |
|
2,479 |
(1,857) |
+4,336 |
|||||||||
Net income (loss) per common share, assuming dilution (dollars) |
1.18 |
(1.56) |
+2.74 |
|
3.48 |
(2.53) |
+6.01 |
|||||||||
Capital and exploration expenditures |
441 |
195 |
+246 |
|
1,140 |
874 |
+266 |
|||||||||
|
|
|||||||||||||||
Imperial reported estimated net income in the fourth quarter of $813 million and cash flow from operating activities of $1,632 million, down from net income of $908 million and cash flow from operating activities of $1,947 million in the third quarter of 2021. Fourth quarter results reflect continued strong operating performance and commodity prices, partly offset by extreme cold weather impacts on the company’s oil sands mining operations in December, and a number of unrelated one-time earnings charges of approximately $160 million. There are no material current or future cash impacts associated with these one-time charges. Full-year estimated net income was $2,479 million, the highest since 2014, with cash flow from operating activities of $5,476 million.
“This past year demonstrated the strength of Imperial’s integrated business model and the value we have created through structural cost reductions, relentless focus on reliable operations and capital-efficient growth in our core businesses,” said Brad Corson, chairman, president and chief executive officer.
Upstream production in the fourth quarter averaged 445,000 gross oil-equivalent barrels per day, bringing annual production to 428,000 gross oil-equivalent barrels per day, the highest annual production in over 30 years. At Kearl, quarterly total gross production averaged 270,000 barrels per day with operations impacted by extreme cold weather in the month of December. On a yearly basis, Kearl’s total gross production of 263,000 barrels per day established a new annual production record, exceeding the previous record by 41,000 barrels per day. At Cold Lake, quarterly production averaged 142,000 barrels per day with annual production of 140,000 barrels per day, driven by the continued focus on production optimization and reliability enhancements.
¹ non-GAAP financial measure - see Attachment VI for definition and reconciliation |
In the Downstream, throughput in the fourth quarter continued to increase, averaging 416,000 barrels per day. Capacity utilization was 97 percent, a further three percent improvement over the third quarter of 2021. Petroleum product sales in the quarter averaged 496,000 barrels per day, reflecting continued recovery in demand for fuel products. Full-year throughput averaged 379,000 barrels per day with capacity utilization of 89 percent and petroleum product sales of 456,000 barrels per day.
Chemical fourth quarter net income was $64 million with full-year net income of $361 million, the highest full-year net income in over 30 years. Chemical results continue to be driven by strength in polyethylene margins and strong operating performance.
During the quarter, Imperial returned $949 million to shareholders through dividend payments and share repurchasing, with full-year shareholder returns of nearly $3 billion, the highest in company history. Further enhancing returns for shareholders, in November the company announced plans to accelerate share repurchasing under its normal course issuer bid program, and purchases of the remainder of the shares available under the program were completed by January 31, 2022. The company also declared a first quarter dividend increase of 26 percent to 34 cents per share.
“Imperial generated about $5.5 billion in cash flow from operating activities with about $4.5 billion in free-cash flow¹ in 2021 and the company is committed to returning cash to shareholders, as demonstrated by our record distributions this past year,” said Corson. “Following the completion of our accelerated normal course issuer bid in January and the sizable dividend increase we announced earlier today, Imperial is actively evaluating options for further shareholder distributions.”
Subsequent to the quarter, Imperial announced plans for further reductions in greenhouse gas emissions intensity over the next decade to help support Canada’s net zero goals. By the end of 2030, Imperial anticipates reducing Scope 1 and 2 greenhouse gas emissions intensity at its operated oil sands facilities by 30 percent, compared with 2016 levels. “I’m proud of the progress we’ve made to-date in reducing the intensity of our greenhouse gas emissions at our operated oil sands assets and our recent announcement is another big step in our journey to net zero at our operated oil sands assets by 2050,” said Corson. “As a founding member of the Oil Sands Pathways to Net Zero alliance, we will continue to collaborate to advance lower-emission solutions.”
Fourth quarter highlights
- Net income of $813 million or $1.18 per share on a diluted basis, compared to a net loss of $1,146 million or $1.56 per share in the fourth quarter of 2020. Net income excluding identified items¹ of $813 million in the fourth quarter of 2021, up from $25 million in the same period of 2020.
- Cash flows from operating activities of $1,632 million, up from $316 million in the same period of 2020. Cash flows from operating activities excluding working capital¹ of $1,648 million, up from $564 million in the same period of 2020.
- Capital and exploration expenditures totalled $441 million, up from $195 million in the fourth quarter of 2020. Full-year capital and exploration expenditures totalled $1,140 million, as the company progressed a number of key projects including Kearl in-pit tailings infrastructure and the replacement of the Sarnia products pipeline.
- The company returned $949 million to shareholders in the fourth quarter of 2021, including $761 million in accelerated share repurchases and $188 million in dividends paid.
- Production averaged 445,000 gross oil-equivalent barrels per day, compared to 460,000 barrels per day in the same period of 2020. Decreased production was primarily driven by impacts from extreme cold weather in December 2021.
- Total gross bitumen production at Kearl averaged 270,000 barrels per day (191,000 barrels Imperial's share), compared to 284,000 barrels per day (202,000 barrels Imperial's share) in the fourth quarter of 2020. Total gross production was impacted by 13,000 barrels per day (9,000 barrels Imperial's share) as a result of extreme cold weather in December 2021.
- Gross bitumen production at Cold Lake averaged 142,000 barrels per day, up from 136,000 barrels per day in the fourth quarter of 2020. Higher production was supported by continued production optimization and reliability enhancements.
- The company's share of gross production from Syncrude averaged 79,000 barrels per day, compared to 87,000 barrels per day in the fourth quarter of 2020. Production was impacted by unscheduled downtime and extreme cold weather in December 2021.
- Refinery throughput averaged 416,000 barrels per day, up from 359,000 barrels per day in the fourth quarter of 2020. Capacity utilization was 97 percent, up from 85 percent in the fourth quarter of 2020. Higher throughput was primarily driven by increased demand.
- Petroleum product sales were 496,000 barrels per day, up from 416,000 barrels per day in the fourth quarter of 2020. Higher petroleum product sales were primarily driven by increased demand.
- Chemical net income of $64 million in the quarter, up from $23 million in the fourth quarter of 2020. Improved results were driven by continued strength in polyethylene margins and strong operating performance.
- In January, announced intention to market interests in XTO Energy Canada jointly with ExxonMobil Canada, consistent with Imperial’s strategy to focus Upstream resources on key oil sands assets. A definitive decision to sell the assets has not been made.
- In January, announced plans for further GHG emissions intensity reductions at the company’s operated oil sands facilities, anticipating a 30 percent reduction by 2030 compared to 2016 levels in support of the company's goal to achieve net zero emissions in its operated oil sands assets by 2050.
Current Business Environment
In early 2020, the balance of supply and demand for petroleum and petrochemical products experienced two significant disruptive effects. On the demand side, the COVID-19 pandemic spread rapidly through most areas of the world resulting in substantial reductions in consumer and business activity and significantly reduced demand for crude oil, natural gas, and petroleum products. This reduction in demand coincided with announcements of increased production in certain key oil-producing countries which led to increases in inventory levels and sharp declines in prices for crude oil, natural gas, and petroleum products.
Through 2021, demand for petroleum and petrochemical products has continued to recover, with the company’s financial results benefiting from stronger prices and margins. The company continues to closely monitor industry and global economic conditions, including recovery from the COVID-19 pandemic.
The general rate of inflation in Canada and many other countries has seen an increase over the past year. Prices for services and materials continue to evolve in response to constant changes in commodity markets and industry activities, impacting operating and capital costs. Generally the company tries to mitigate those impacts by cost reductions from efficiency and productivity improvements.
Operating Results
Fourth quarter 2021 vs. fourth quarter 2020
|
Fourth Quarter |
|
millions of Canadian dollars, unless noted |
2021 |
2020 |
Net income (loss) (U.S. GAAP) |
813 |
(1,146) |
Net income (loss) per common share, assuming dilution (dollars) |
1.18 |
(1.56) |
Net income (loss) excluding identified items (a) |
813 |
25 |
(a) non-GAAP financial measure - see Attachment VI for definition and reconciliation |
||
|
|
|
The company recorded net income of $813 million or $1.18 per share on a diluted basis in the fourth quarter of 2021, compared to a net loss of $1,146 million or $1.56 per share on a diluted basis in the fourth quarter of 2020. Prior year results included unfavourable identified items¹ of $1,171 million related to the company's decision to no longer develop a significant portion of its unconventional portfolio. |
||
Upstream
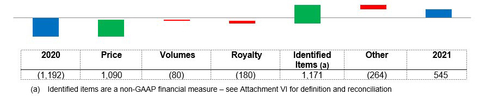
Net income (loss) factor analysis
millions of Canadian dollars
Price – Higher realizations increased net income by about $1,090 million, primarily driven by average bitumen realizations increasing by $31.34 per barrel and synthetic realizations increasing by $41.26 per barrel.
Volumes – Lower volumes primarily driven by extreme cold weather at Kearl and Syncrude and unplanned downtime at Syncrude decreased net income by about $80 million.
Royalty – Higher royalties decreased net income by about $180 million, primarily driven by higher commodity prices.
Identified items1 – Prior year results included unfavourable identified items¹ of $1,171 million related to the company's decision to no longer develop a significant portion of its unconventional portfolio.
Other – All other items decreased net income by $264 million, primarily driven by higher operating expenses of about $230 million and unfavourable foreign exchange impacts of about $50 million.
Average realizations and marker prices |
||
|
Fourth Quarter |
|
Canadian dollars, unless noted |
2021 |
2020 |
West Texas Intermediate (US$) |
77.04 |
42.70 |
Western Canada Select (US$) |
62.49 |
33.35 |
WTI/WCS Spread (US$) |
14.55 |
9.35 |
Bitumen (per barrel) |
65.53 |
34.19 |
Synthetic oil (per barrel) |
92.54 |
51.28 |
Average foreign exchange rate (US$) |
0.79 |
0.77 |
Imperial’s average Canadian dollar realizations for bitumen increased in the quarter, generally in line with WCS. The company’s average Canadian dollar realizations for synthetic crude increased generally in line with WTI, adjusted for changes in exchange rates and transportation costs.
Production |
||
|
Fourth Quarter |
|
thousands of barrels per day |
2021 |
2020 |
Kearl (Imperial's share) |
191 |
202 |
Cold Lake |
142 |
136 |
Syncrude (Imperial's share) |
79 |
87 |
|
|
|
Kearl total gross production (thousands of barrels per day) |
270 |
284 |
|
|
|
Lower production at Kearl was primarily as a result of extreme cold weather in December of 2021. |
||
|
|
|
Lower production at Syncrude was primarily driven by unscheduled downtime and extreme cold weather in December of 2021. |
||
Downstream
Net income (loss) factor analysis
millions of Canadian dollars
Margins – Higher margins increased net income by about $260 million, reflecting improved product demand.
Other – All other items reduced net income by $116 million, which included an unfavourable out-of-period inventory adjustment of $60 million2.
Refinery utilization and petroleum product sales |
||
|
Fourth Quarter |
|
thousands of barrels per day, unless noted |
2021 |
2020 |
Refinery throughput |
416 |
359 |
Refinery capacity utilization (percent) |
97 |
85 |
Petroleum product sales |
496 |
416 |
Improved refinery throughput in the fourth quarter of 2021 primarily reflects increased demand.
Improved petroleum product sales in the fourth quarter of 2021 primarily reflects increased demand.
2 In the fourth quarter, the company recorded an unfavourable $60 million out-of-period inventory adjustment. The inventory adjustment related to reconciliations of additives at third-party terminals and products inventory at equity and third-party terminals which have been resolved. |
Chemicals
Net income (loss) factor analysis
millions of Canadian dollars
Margins – Improved margins increased net income by about $60 million, primarily due to stronger industry polyethylene margins.
Corporate and other
|
Fourth Quarter |
|
millions of Canadian dollars |
2021 |
2020 |
Net income (loss) (U.S. GAAP) |
(46) |
(83) |
Liquidity and capital resources
|
Fourth Quarter |
|
millions of Canadian dollars |
2021 |
2020 |
Cash flow generated from (used in): |
|
|
Operating activities |
1,632 |
316 |
Investing activities |
(399) |
(197) |
Financing activities |
(955) |
(165) |
Increase (decrease) in cash and cash equivalents |
278 |
(46) |
Cash flow generated from operating activities primarily reflects higher Upstream realizations and stronger Downstream margins.
|
Fourth Quarter |
|
millions of Canadian dollars, unless noted |
2021 |
2020 |
Dividends paid |
188 |
161 |
Per share dividend paid (dollars) |
0.27 |
0.22 |
Share repurchases (a) |
761 |
- |
Number of shares purchased (millions) (a) (b) |
17.5 |
- |
(a) The company did not purchase shares during the fourth quarter of 2020, except for limited purchases to eliminate dilution in conjunction with its restricted stock unit plan |
||
(b) Share repurchases were made under the company’s normal course issuer bid program, and include shares purchased from Exxon Mobil Corporation concurrent with, but outside of the normal course issuer bid. |
||
The company’s cash balance was $2,153 million at December 31, 2021, versus $771 million at the end of fourth quarter 2020.
Full-year 2021 vs. full-year 2020
|
Twelve Months |
|
millions of Canadian dollars, unless noted |
2021 |
2020 |
Net income (loss) (U.S. GAAP) |
2,479 |
(1,857) |
Net income (loss) per common share, assuming dilution (dollars) |
3.48 |
(2.53) |
Net income (loss) excluding identified items (a) |
2,479 |
(686) |
(a) non-GAAP financial measure - see Attachment VI for definition and reconciliation |
||
|
|
|
The company recorded net income of $2,479 million or $3.48 per share on a diluted basis in 2021, compared to a net loss of $1,857 million or $2.53 per share in 2020. Prior year results included unfavourable identified items¹ of $1,171 million related to the company's decision to no longer develop a significant portion of its unconventional portfolio. |
||
Upstream
Net income (loss) factor analysis
millions of Canadian dollars
Price – Higher realizations increased net income by about $3,640 million, primarily driven by average bitumen realizations increasing by $32.22 per barrel and synthetic realizations increasing by $31.85 per barrel.
Volumes – Higher volumes primarily driven by the absence of production balancing with market demands increased net income by about $550 million.
Royalty – Higher royalties decreased net income by about $680 million, primarily driven by higher commodity prices.
Identified items1 – Prior year results included unfavourable identified items¹ of $1,171 million related to the company's decision to no longer develop a significant portion of its unconventional portfolio.
Other – All other items decreased net income by $968 million, primarily driven by higher operating expenses of about $720 million, unfavourable foreign exchange impacts of about $230 million and lower Canada Emergency Wage Subsidy received by the company compared to prior year of about $60 million, which includes Imperial's proportionate share of a joint venture.
Average realizations and marker prices |
||
|
Twelve Months |
|
Canadian dollars, unless noted |
2021 |
2020 |
West Texas Intermediate (US$) |
68.05 |
39.26 |
Western Canada Select (US$) |
54.96 |
26.87 |
WTI/WCS Spread (US$) |
13.09 |
12.39 |
Bitumen (per barrel) |
57.91 |
25.69 |
Synthetic oil (per barrel) |
81.61 |
49.76 |
Average foreign exchange rate (US$) |
0.80 |
0.75 |
Imperial’s average Canadian dollar realizations for bitumen increased in 2021, generally in line with WCS. The company’s average Canadian dollar realizations for synthetic crude increased generally in line with WTI, adjusted for changes in exchange rates and transportation costs.
¹ non-GAAP financial measure - see Attachment VI for definition and reconciliation |
Production |
||
|
Twelve Months |
|
thousands of barrels per day |
2021 |
2020 |
Kearl (Imperial's share) |
186 |
158 |
Cold Lake |
140 |
132 |
Syncrude (Imperial's share) |
71 |
69 |
|
|
|
Kearl total gross production (thousands of barrels per day) |
263 |
222 |
|
|
|
Higher production at Kearl was primarily driven by the absence of prior year production balancing with market demands. |
||
Downstream
Net income (loss) factor analysis
millions of Canadian dollars
Margins – Higher margins increased net income by about $600 million, reflecting improved product demand.
Other – All other items decreased net income by $258 million, primarily driven by unfavourable foreign exchange impacts of about $150 million and an unfavourable out-of-period inventory adjustment of $74 million3, partially offset by lower operating expenses of about $50 million.
Refinery utilization and petroleum product sales |
||
|
Twelve Months |
|
thousands of barrels per day, unless noted |
2021 |
2020 |
Refinery throughput |
379 |
340 |
Refinery capacity utilization (percent) |
89 |
80 |
Petroleum product sales |
456 |
421 |
Improved refinery throughput in 2021 primarily reflects reduced impacts associated with the COVID-19 pandemic, partially offset by a planned turnaround at Strathcona.
Improved petroleum product sales in 2021 primarily reflects reduced impacts associated with the COVID-19 pandemic.
3 In 2021, the company recorded an unfavourable $74 million out-of-period inventory adjustment. The inventory adjustment related to reconciliations of additives and products inventory at equity and third-party terminals which have been resolved. |
Chemicals
Net income (loss) factor analysis
millions of Canadian dollars
Margins – Improved margins increased net income by about $250 million, primarily due to stronger industry polyethylene margins.
Corporate and other
|
Twelve Months |
|
millions of Canadian dollars |
2021 |
2020 |
Net income (loss) (U.S. GAAP) |
(172) |
(170) |
Liquidity and capital resources
|
Twelve Months |
|
millions of Canadian dollars |
2021 |
2020 |
Cash flow generated from (used in): |
|
|
Operating activities |
5,476 |
798 |
Investing activities |
(1,012) |
(802) |
Financing activities |
(3,082) |
(943) |
Increase (decrease) in cash and cash equivalents |
1,382 |
(947) |
Cash flow generated from operating activities primarily reflects higher Upstream realizations and stronger Downstream margins.
|
Twelve Months |
|
millions of Canadian dollars, unless noted |
2021 |
2020 |
Dividends paid |
706 |
649 |
Per share dividend paid (dollars) |
0.98 |
0.88 |
Share repurchases |
2,245 |
274 |
Number of shares purchased (millions) (a) |
56.0 |
9.8 |
(a) Share repurchases were made under the company’s normal course issuer bid program, and include shares purchased from Exxon Mobil Corporation concurrent with, but outside of the normal course issuer bid. |
||
At March 31, 2021, due to the termination of transportation services agreements related to a third-party pipeline project, the company recognized a liability of $62 million, previously reported as a contingent liability in Note 10 of Imperial’s Form 10-K. In connection with the same project, commitments under “Other long-term purchase agreements” as reported in Imperial’s Form 10-K decreased by approximately $2.9 billion. The majority of these commitments related to years 2026 and beyond.
Key financial and operating data follow.
Forward-looking statements
Statements of future events or conditions in this report, including projections, targets, expectations, estimates, and business plans are forward-looking statements. Forward-looking statements can be identified by words such as believe, anticipate, intend, propose, plan, goal, seek, project, predict, target, estimate, expect, strategy, outlook, schedule, future, continue, likely, may, should, will and similar references to future periods. Forward-looking statements in this report include, but are not limited to, references to plans for 2030 oil sands greenhouse gas emission intensity reduction in support of its goal to achieve net zero emissions in its operated oil sands assets by 2050; the company’s commitment to returning cash to shareholders, including actively evaluating options for further shareholder distributions; continuing to collaborate and invest in opportunities to advance lower-emission solutions, including through the Oil Sands Pathways to Net Zero alliance; the company’s intention to market interests in XTO Energy Canada; closely monitoring industry and economic conditions and the effects from the COVID-19 pandemic; and constant changes in prices for services and materials, its impact on operating and capital costs, and the company’s ability to mitigate those impacts through efficiency and productivity improvements.
Forward-looking statements are based on the company's current expectations, estimates, projections and assumptions at the time the statements are made. Actual future financial and operating results, including expectations and assumptions concerning demand growth and energy source, supply and mix; production rates, growth and mix across various assets; project plans, timing, costs, technical evaluations and capacities and the company’s ability to effectively execute on these plans and operate its assets; the adoption and impact of new facilities or technologies on reductions to GHG emissions intensity, including but not limited to next generation technologies using solvents to replace energy intensive steam at Cold Lake, boiler flue gas technology at Kearl, and support for and advancement of carbon capture and storage, and any changes in the scope, terms, or costs of such projects; the amount and timing of emissions reductions; support from policymakers and other stakeholders for various new technologies such as carbon capture and storage; applicable laws and government policies, including with respect to climate change and GHG emissions reductions; for shareholder returns, assumptions such as cash flow forecasts, financing sources and capital structure, regulatory approvals, participation of the company’s majority shareholder and the results of periodic and ongoing evaluation of alternate uses of capital; applicable laws and government policies, including restrictions in response to COVID-19; receipt of regulatory approvals; capital and environmental expenditures; progression of COVID-19 and its impacts on Imperial’s ability to operate its assets, including the possible shutdown of facilities due to COVID-19 outbreaks; the company’s ability to effectively execute on its business continuity plans and pandemic response activities; and commodity prices, foreign exchange rates and general market conditions could differ materially depending on a number of factors.
These factors include global, regional or local changes in supply and demand for oil, natural gas, and petroleum and petrochemical products and resulting price, differential and margin impacts, including foreign government action with respect to supply levels and prices and the impact of COVID-19 on demand; availability and allocation of capital; political or regulatory events, including changes in law or government policy, environmental regulation including climate change and greenhouse gas regulation, and actions in response to COVID-19; the results of research programs and new technologies, the ability to bring new technologies to commercial scale on a cost-competitive basis, and the competitiveness of alternative energy and other emission reduction technologies; lack of required support from governments and policymakers for adoption of new technologies for emissions reductions; unanticipated technical or operational difficulties; project management and schedules and timely completion of projects; availability and performance of third-party service providers, including in light of restrictions related to COVID-19; environmental risks inherent in oil and gas exploration and production activities; the receipt, in a timely manner, of regulatory and third-party approvals; management effectiveness and disaster response preparedness, including business continuity plans in response to COVID-19; operational hazards and risks; cybersecurity incidents, including increased reliance on remote working arrangements and activation of business continuity plans due to COVID-19; currency exchange rates; general economic conditions; and other factors discussed in Item 1A risk factors and Item 7 management’s discussion and analysis of financial condition and results of operations of Imperial Oil Limited’s most recent annual report on Form 10-K and subsequent interim reports.
Forward-looking statements are not guarantees of future performance and involve a number of risks and uncertainties, some that are similar to other oil and gas companies and some that are unique to Imperial Oil Limited. Imperial’s actual results may differ materially from those expressed or implied by its forward-looking statements and readers are cautioned not to place undue reliance on them. Imperial undertakes no obligation to update any forward-looking statements contained herein, except as required by applicable law.
In this release all dollar amounts are expressed in Canadian dollars unless otherwise stated. This release should be read in conjunction with Imperial’s most recent Form 10-K. Note that numbers may not add due to rounding.
The term “project” as used in this release can refer to a variety of different activities and does not necessarily have the same meaning as in any government payment transparency reports.
|
|
|
|
|
|
||||
|
|
|
Attachment I |
||||||
|
|
|
|
|
|
||||
|
|
|
|
|
|
||||
|
Fourth Quarter |
|
Twelve Months |
||||||
millions of Canadian dollars, unless noted |
2021 |
2020 |
|
2021 |
2020 |
||||
|
|
|
|
|
|
||||
Net Income (loss) (U.S. GAAP) |
|
|
|
|
|
||||
Total revenues and other income |
12,312 |
6,033 |
|
37,590 |
22,388 |
||||
Total expenses |
11,201 |
7,496 |
|
34,307 |
24,796 |
||||
Income (loss) before income taxes |
1,111 |
(1,463) |
|
3,283 |
(2,408) |
||||
Income taxes |
298 |
(317) |
|
804 |
(551) |
||||
Net income (loss) |
813 |
(1,146) |
|
2,479 |
(1,857) |
||||
|
|
|
|
|
|
||||
Net income (loss) per common share (dollars) |
1.18 |
(1.56) |
|
3.48 |
(2.53) |
||||
Net income (loss) per common share - assuming dilution (dollars) |
1.18 |
(1.56) |
|
3.48 |
(2.53) |
||||
|
|
|
|
|
|
||||
Other Financial Data |
|
|
|
|
|
||||
Gain (loss) on asset sales, after tax |
9 |
7 |
|
43 |
32 |
||||
|
|
|
|
|
|
||||
Total assets at December 31 |
|
|
|
40,592 |
38,031 |
||||
|
|
|
|
|
|
||||
Total debt at December 31 |
|
|
|
5,176 |
5,184 |
||||
|
|
|
|
|
|
||||
Shareholders' equity at December 31 |
|
|
|
21,735 |
21,418 |
||||
|
|
|
|
|
|
||||
Capital employed at December 31 |
|
|
|
26,931 |
26,628 |
||||
|
|
|
|
|
|
||||
Dividends declared on common stock |
|
|
|
|
|
||||
Total |
185 |
162 |
|
729 |
647 |
||||
Per common share (dollars) |
0.27 |
0.22 |
|
1.03 |
0.88 |
||||
|
|
|
|
|
|
||||
Millions of common shares outstanding |
|
|
|
|
|
||||
At December 31 |
|
|
|
678.1 |
734.1 |
||||
Average - assuming dilution |
689.5 |
734.1 |
|
713.2 |
735.3 |
||||
|
|
|
|
|
|
||||
|
|
|
|
|
|
|
|
|
Attachment II |
||
|
|
|
|
|
|
|
|
|
|
|
|
|
Fourth Quarter |
|
Twelve Months |
||
millions of Canadian dollars |
2021 |
2020 |
|
2021 |
2020 |
|
|
|
|
|
|
Total cash and cash equivalents at period end |
2,153 |
771 |
|
2,153 |
771 |
|
|
|
|
|
|
Operating Activities |
|
|
|
|
|
Net income (loss) |
813 |
(1,146) |
|
2,479 |
(1,857) |
Adjustments for non-cash items: |
|
|
|
|
|
Depreciation and depletion |
545 |
1,998 |
|
1,977 |
3,273 |
Impairment of intangible assets |
- |
- |
|
- |
20 |
(Gain) loss on asset sales |
(10) |
(7) |
|
(49) |
(35) |
Deferred income taxes and other |
75 |
(311) |
|
91 |
(521) |
Changes in operating assets and liabilities |
(16) |
(248) |
|
363 |
(335) |
All other items - net |
225 |
30 |
|
615 |
253 |
Cash flows from (used in) operating activities |
1,632 |
316 |
|
5,476 |
798 |
|
|
|
|
|
|
|
|
|
|
|
|
Investing Activities |
|
|
|
|
|
Additions to property, plant and equipment |
(424) |
(211) |
|
(1,108) |
(868) |
Proceeds from asset sales |
24 |
14 |
|
81 |
82 |
Loans to equity companies - net |
1 |
- |
|
15 |
(16) |
Cash flows from (used in) investing activities |
(399) |
(197) |
|
(1,012) |
(802) |
|
|
|
|
|
|
Cash flows from (used in) financing activities |
(955) |
(165) |
|
(3,082) |
(943) |
|
|
|
|
|
|
|
|
|
|
|
|
|||||
|
|
|
Attachment III |
|||||||
|
|
|
|
|
|
|||||
|
|
|
|
|
|
|||||
|
Fourth Quarter |
|
Twelve Months |
|||||||
millions of Canadian dollars |
2021 |
2020 |
|
2021 |
2020 |
|||||
|
|
|
|
|
|
|||||
Net income (loss) (U.S. GAAP) |
|
|
|
|
|
|||||
Upstream |
545 |
(1,192) |
|
1,395 |
(2,318) |
|||||
Downstream |
250 |
106 |
|
895 |
553 |
|||||
Chemical |
64 |
23 |
|
361 |
78 |
|||||
Corporate and other |
(46) |
(83) |
|
(172) |
(170) |
|||||
Net income (loss) |
813 |
(1,146) |
|
2,479 |
(1,857) |
|||||
|
|
|
|
|
|
|||||
Revenues and other income |
|
|
|
|
|
|||||
Upstream |
4,252 |
2,940 |
|
15,831 |
8,797 |
|||||
Downstream |
14,453 |
4,213 |
|
34,786 |
16,736 |
|||||
Chemical |
449 |
281 |
|
1,758 |
1,008 |
|||||
Eliminations / Corporate and other |
(6,842) |
(1,401) |
|
(14,785) |
(4,153) |
|||||
Revenues and other income |
12,312 |
6,033 |
|
37,590 |
22,388 |
|||||
|
|
|
|
|
|
|||||
Purchases of crude oil and products |
|
|
|
|
|
|||||
Upstream |
1,712 |
1,496 |
|
7,492 |
4,834 |
|||||
Downstream |
12,980 |
3,060 |
|
29,505 |
12,047 |
|||||
Chemical |
273 |
163 |
|
966 |
579 |
|||||
Eliminations |
(6,843) |
(1,401) |
|
(14,789) |
(4,167) |
|||||
Purchases of crude oil and products |
8,122 |
3,318 |
|
23,174 |
13,293 |
|||||
|
|
|
|
|
|
|||||
Production and manufacturing |
|
|
|
|
|
|||||
Upstream |
1,266 |
997 |
|
4,661 |
3,852 |
|||||
Downstream |
406 |
382 |
|
1,445 |
1,468 |
|||||
Chemical |
65 |
58 |
|
210 |
215 |
|||||
Eliminations |
- |
- |
|
- |
- |
|||||
Production and manufacturing |
1,737 |
1,437 |
|
6,316 |
5,535 |
|||||
|
|
|
|
|
|
|||||
Selling and general |
|
|
|
|
|
|||||
Upstream |
- |
- |
|
- |
- |
|||||
Downstream |
156 |
163 |
|
572 |
619 |
|||||
Chemical |
22 |
23 |
|
90 |
92 |
|||||
Eliminations / Corporate and other |
37 |
56 |
|
122 |
30 |
|||||
Selling and general |
215 |
242 |
|
784 |
741 |
|||||
|
|
|
|
|
|
|||||
Capital and exploration expenditures |
|
|
|
|
|
|||||
Upstream |
266 |
107 |
|
632 |
561 |
|||||
Downstream |
168 |
74 |
|
476 |
251 |
|||||
Chemical |
2 |
6 |
|
8 |
21 |
|||||
Corporate and other |
5 |
8 |
|
24 |
41 |
|||||
Capital and exploration expenditures |
441 |
195 |
|
1,140 |
874 |
|||||
|
|
|
|
|
|
|||||
Exploration expenses charged to Upstream income included above |
26 |
7 |
|
32 |
13 |
|||||
|
|
|
|
|
|
|||||
|
|
|
|
|
|
|
|
Attachment IV |
|||
|
|
|
|
|
|
|
|
|
|
|
|
Operating statistics |
Fourth Quarter |
|
Twelve Months |
||
|
2021 |
2020 |
|
2021 |
2020 |
|
|
|
|
|
|
Gross crude oil and natural gas liquids (NGL) production |
|
|
|
|
|
(thousands of barrels per day) |
|
|
|
|
|
Kearl |
191 |
202 |
|
186 |
158 |
Cold Lake |
142 |
136 |
|
140 |
132 |
Syncrude |
79 |
87 |
|
71 |
69 |
Conventional |
11 |
10 |
|
10 |
11 |
Total crude oil production |
423 |
435 |
|
407 |
370 |
NGLs available for sale |
2 |
2 |
|
1 |
2 |
Total crude oil and NGL production |
425 |
437 |
|
408 |
372 |
|
|
|
|
|
|
Gross natural gas production (millions of cubic feet per day) |
121 |
140 |
|
120 |
154 |
|
|
|
|
|
|
Gross oil-equivalent production (a) |
445 |
460 |
|
428 |
398 |
(thousands of oil-equivalent barrels per day) |
|
|
|
|
|
|
|
|
|
|
|
Net crude oil and NGL production (thousands of barrels per day) |
|
|
|
|
|
Kearl |
179 |
199 |
|
178 |
155 |
Cold Lake |
119 |
120 |
|
114 |
124 |
Syncrude |
68 |
82 |
|
62 |
68 |
Conventional |
11 |
14 |
|
9 |
10 |
Total crude oil production |
377 |
415 |
|
363 |
357 |
NGLs available for sale |
1 |
2 |
|
1 |
2 |
Total crude oil and NGL production |
378 |
417 |
|
364 |
359 |
|
|
|
|
|
|
Net natural gas production (millions of cubic feet per day) |
112 |
136 |
|
115 |
150 |
|
|
|
|
|
|
Net oil-equivalent production (a) |
397 |
440 |
|
383 |
384 |
(thousands of oil-equivalent barrels per day) |
|
|
|
|
|
|
|
|
|
|
|
Kearl blend sales (thousands of barrels per day) |
272 |
278 |
|
264 |
222 |
Cold Lake blend sales (thousands of barrels per day) |
189 |
184 |
|
187 |
179 |
NGL sales (thousands of barrels per day) (b) |
- |
1 |
|
- |
2 |
|
|
|
|
|
|
Average realizations (Canadian dollars) |
|
|
|
|
|
Bitumen (per barrel) |
65.53 |
34.19 |
|
57.91 |
25.69 |
Synthetic oil (per barrel) |
92.54 |
51.28 |
|
81.61 |
49.76 |
Conventional crude oil (per barrel) |
70.09 |
27.21 |
|
59.84 |
29.34 |
NGL (per barrel) |
62.07 |
19.03 |
|
35.87 |
13.85 |
Natural gas (per thousand cubic feet) |
4.92 |
2.25 |
|
3.83 |
1.90 |
|
|
|
|
|
|
Refinery throughput (thousands of barrels per day) |
416 |
359 |
|
379 |
340 |
Refinery capacity utilization (percent) |
97 |
85 |
|
89 |
80 |
|
|
|
|
|
|
Petroleum product sales (thousands of barrels per day) |
|
|
|
|
|
Gasolines |
240 |
211 |
|
224 |
215 |
Heating, diesel and jet fuels |
180 |
144 |
|
160 |
146 |
Heavy fuel oils |
32 |
21 |
|
27 |
20 |
Lube oils and other products |
44 |
40 |
|
45 |
40 |
Net petroleum products sales |
496 |
416 |
|
456 |
421 |
|
|
|
|
|
|
Petrochemical sales (thousands of tonnes) |
194 |
176 |
|
831 |
749 |
|
|
|
|
|
|
(a) |
Gas converted to oil-equivalent at six million cubic feet per one thousand barrels. |
|
(b) |
Fourth quarter and twelve months 2021 NGL sales round to 0. |
|
|
|
|
|
|
|
|
|
|
|
|
Attachment V |
|||
|
|
|
|
|
|
|
|
|
|
|
|
|
|
|
|
|
|
|
|
|
Net income (loss) per |
||
|
|
Net income (loss) (U.S. GAAP) |
common share - diluted (a) |
||||
|
|
millions of Canadian dollars |
|
|
Canadian dollars |
||
|
|
|
|
|
|
|
|
2017 |
|
|
|
|
|
||
First Quarter |
333 |
|
|
|
0.39 |
||
Second Quarter |
(77) |
|
|
|
(0.09) |
||
Third Quarter |
371 |
|
|
|
0.44 |
||
Fourth Quarter |
(137) |
|
|
|
(0.16) |
||
Year |
490 |
|
|
|
0.58 |
||
|
|
|
|
|
|
|
|
2018 |
|
|
|
|
|
||
First Quarter |
516 |
|
|
|
0.62 |
||
Second Quarter |
196 |
|
|
|
0.24 |
||
Third Quarter |
749 |
|
|
|
0.94 |
||
Fourth Quarter |
853 |
|
|
|
1.08 |
||
Year |
2,314 |
|
|
|
2.86 |
||
|
|
|
|
|
|
|
|
2019 |
|
|
|
|
|
||
First Quarter |
293 |
|
|
|
0.38 |
||
Second Quarter |
1,212 |
|
|
|
1.57 |
||
Third Quarter |
424 |
|
|
|
0.56 |
||
Fourth Quarter |
271 |
|
|
|
0.36 |
||
Year |
2,200 |
|
|
|
2.88 |
||
|
|
|
|
|
|
|
|
2020 |
|
|
|
|
|
||
First Quarter |
(188) |
|
|
|
(0.25) |
||
Second Quarter |
(526) |
|
|
|
(0.72) |
||
Third Quarter |
3 |
|
|
|
- |
||
Fourth Quarter |
(1,146) |
|
|
|
(1.56) |
||
Year |
(1,857) |
|
|
|
(2.53) |
||
|
|
|
|
|
|
|
|
2021 |
|
|
|
|
|
||
First Quarter |
392 |
|
|
|
0.53 |
||
Second Quarter |
366 |
|
|
|
0.50 |
||
Third Quarter |
908 |
|
|
|
1.29 |
||
Fourth Quarter |
813 |
|
|
|
1.18 |
||
Year |
2,479 |
|
|
|
3.48 |
||
(a) |
Computed using the average number of shares outstanding during each period. The sum of the quarters presented may not add to the year total. |
||||||
Attachment VI
Non-GAAP financial measures and other specified financial measures
Certain measures included in this document are not prescribed by U.S. Generally Accepted Accounting Principles (GAAP). These measures constitute “non-GAAP financial measures” under Securities and Exchange Commission Regulation G, and “specified financial measures” under National Instrument 52-112 Non-GAAP and Other Financial Measures Disclosure of the Canadian Securities Administrators.
Reconciliation of these non-GAAP financial measures to the most comparable GAAP measure, and other information required by these regulations have been provided. Non-GAAP financial measures and specified financial measures are not standardized financial measures under GAAP and do not have a standardized definition. As such, these measures may not be directly comparable to measures presented by other companies, and should not be considered a substitute for GAAP financial measures.
Cash flows from (used in) operating activities excluding working capital
Cash flows from (used in) operating activities excluding working capital is a non-GAAP financial measure that is the total cash flows from operating activities less the changes in operating assets and liabilities in the period. The most directly comparable financial measure that is disclosed in the financial statements is cash flows from (used in) operating activities within the company’s Consolidated statement of cash flows. Management believes it is useful for investors to consider these numbers in comparing the underlying performance of the company’s business across periods when there are significant period-to-period differences in the amount of changes in working capital. Changes in working capital is equal to “Changes in operating assets and liabilities” as disclosed in the company’s Consolidated statement of cash flows and in Attachment II of this document. This measure assesses the cash flows at an operating level, and as such, does not include proceeds from asset sales as defined in Cash flows from operating activities and asset sales in the Frequently Used Terms section of the company’s annual Form 10-K.
Reconciliation of cash flows from (used in) operating activities excluding working capital
|
Fourth Quarter |
|
Twelve Months |
||
millions of Canadian dollars |
2021 |
2020 |
|
2021 |
2020 |
From Imperial's Consolidated statement of cash flows |
|
|
|
|
|
Cash flows from (used in) operating activities |
1,632 |
316 |
|
5,476 |
798 |
|
|
|
|
|
|
Less changes in working capital |
|
|
|
|
|
Changes in operating assets and liabilities |
(16) |
(248) |
|
363 |
(335) |
Cash flows from (used in) operating activities excl. working capital |
1,648 |
564 |
|
5,113 |
1,133 |
Free cash flow
Free cash flow is a non-GAAP financial measure that is cash flows from operating activities less additions to property, plant and equipment and equity company investments plus proceeds from asset sales. The most directly comparable financial measure that is disclosed in the financial statements is cash flows from (used in) operating activities within the company’s Consolidated statement of cash flows. This measure is used to evaluate cash available for financing activities (including but not limited to dividends and share purchases) after investment in the business.
Reconciliation of free cash flow
|
Fourth Quarter |
|
Twelve Months |
||
millions of Canadian dollars |
2021 |
2020 |
|
2021 |
2020 |
From Imperial's Consolidated statement of cash flows |
|
|
|
|
|
Cash flows from (used in) operating activities |
1,632 |
316 |
|
5,476 |
798 |
|
|
|
|
|
|
Cash flows from (used in) investing activities |
|
|
|
|
|
Additions to property, plant and equipment |
(424) |
(211) |
|
(1,108) |
(868) |
Proceeds from asset sales |
24 |
14 |
|
81 |
82 |
Loans to equity companies - net |
1 |
- |
|
15 |
(16) |
Free cash flow |
1,233 |
119 |
|
4,464 |
(4) |
Net income (loss) excluding identified items
Net income (loss) excluding identified items is a non-GAAP financial measure that is total net income (loss) excluding individually significant non-operational events with an absolute corporate total earnings impact of at least $100 million in a given quarter. The net income (loss) impact of an identified item for an individual segment in a given quarter may be less than $100 million when the item impacts several segments or several periods. The most directly comparable financial measure that is disclosed in the financial statements is net income (loss) within the company’s Consolidated statement of income. Management uses these figures to improve comparability of the underlying business across multiple periods by isolating and removing significant non-operational events from business results. The company believes this view provides investors increased transparency into business results and trends, and provides investors with a view of the business as seen through the eyes of management. Net income (loss) excluding identified items is not meant to be viewed in isolation or as a substitute for net income (loss) as prepared in accordance with U.S. GAAP. All identified items are presented on an after-tax basis.
Reconciliation of net income (loss) excluding identified items
|
Fourth Quarter |
|
Twelve Months |
||
millions of Canadian dollars |
2021 |
2020 |
|
2021 |
2020 |
From Imperial's Consolidated statement of income |
|
|
|
|
|
Net income (loss) (U.S. GAAP) |
813 |
(1,146) |
|
2,479 |
(1,857) |
|
|
|
|
|
|
Less identified items included in Net income (loss) |
|
|
|
|
|
Impairments |
- |
(1,171) |
|
- |
(1,171) |
Subtotal of identified items |
- |
(1,171) |
|
- |
(1,171) |
|
|
|
|
|
|
Net income (loss) excluding identified items |
813 |
25 |
|
2,479 |
(686) |
Cash operating costs (cash costs)
Cash operating costs is a non-GAAP financial measure that consists of total expenses, less costs that are non-cash in nature, including, Purchases of crude oil and products, Federal excise taxes and fuel charge, Depreciation and depletion, Non-service pension and postretirement benefit, and Financing. The components of cash operating costs include (1) Production and manufacturing, (2) Selling and general and (3) Exploration, from the company’s Consolidated statement of income, and as disclosed in Attachment III of this document. The sum of these income statement lines serve as an indication of cash operating costs and does not reflect the total cash expenditures of the company. The most directly comparable financial measure that is disclosed in the financial statements is total expenses within the company’s Consolidated statement of income. This measure is useful for investors to understand the company’s efforts to optimize cash through disciplined expense management.
Reconciliation of cash operating costs |
|
|
|
|
|
|
Fourth Quarter |
|
Twelve Months |
||
millions of Canadian dollars |
2021 |
2020 |
|
2021 |
2020 |
From Imperial's Consolidated statement of Income |
|
|
|
|
|
Total expenses |
11,201 |
7,496 |
|
34,307 |
24,796 |
Less: |
|
|
|
|
|
Purchases of crude oil and products |
8,122 |
3,318 |
|
23,174 |
13,293 |
Federal excise taxes and fuel charge |
524 |
446 |
|
1,928 |
1,736 |
Depreciation and depletion |
545 |
1,998 |
|
1,977 |
3,293 |
Non-service pension and postretirement benefit |
10 |
30 |
|
42 |
121 |
Financing |
22 |
18 |
|
54 |
64 |
Total cash operating costs |
1,978 |
1,686 |
|
7,132 |
6,289 |
|
|
|
|
|
|
Components of cash operating costs |
|
|
|
|
|
|
Fourth Quarter |
|
Twelve Months |
||
millions of Canadian dollars |
2021 |
2020 |
|
2021 |
2020 |
From Imperial's Consolidated statement of Income |
|
|
|
|
|
Production and manufacturing |
1,737 |
1,437 |
|
6,316 |
5,535 |
Selling and general |
215 |
242 |
|
784 |
741 |
Exploration |
26 |
7 |
|
32 |
13 |
Cash operating costs |
1,978 |
1,686 |
|
7,132 |
6,289 |
Segment contributions to total cash operating costs |
|
|
|
|
|
|
Fourth Quarter |
|
Twelve Months |
||
millions of Canadian dollars |
2021 |
2020 |
|
2021 |
2020 |
Upstream |
1,292 |
1,004 |
|
4,693 |
3,865 |
Downstream |
562 |
545 |
|
2,017 |
2,087 |
Chemicals |
87 |
81 |
|
300 |
307 |
Corporate/Eliminations |
37 |
56 |
|
122 |
30 |
Cash operating costs |
1,978 |
1,686 |
|
7,132 |
6,289 |
Unit cash operating cost (unit cash costs)
Unit cash operating costs is a non-GAAP ratio. Unit cash operating costs (unit cash costs) is calculated by dividing cash operating costs by total gross oil-equivalent production, and is calculated for the Upstream segment, as well as the major Upstream assets. Cash operating costs is a non-GAAP financial measure and is disclosed and reconciled above. This measure is useful for investors to understand the expense management efforts of the company’s major assets as a component of the overall Upstream segment. Unit cash operating cost, as used by management, does not directly align with the definition of “Average unit production costs” as set out by the U.S. Securities and Exchange Commission (SEC), and disclosed in the company’s SEC Form 10-K.
Components of unit cash operating cost
|
Fourth Quarter |
|||||||||||||||||
|
2021 |
|
2020 |
|||||||||||||||
millions of Canadian dollars |
Upstream
|
Kearl |
Cold
|
Syncrude |
|
Upstream
|
Kearl |
Cold
|
Syncrude |
|||||||||
Production and manufacturing |
1,266 |
561 |
315 |
333 |
|
997 |
398 |
267 |
277 |
|||||||||
Selling and general |
- |
- |
- |
- |
|
- |
- |
- |
- |
|||||||||
Exploration |
26 |
- |
- |
- |
|
7 |
- |
- |
- |
|||||||||
Cash operating costs |
1,292 |
561 |
315 |
333 |
|
1,004 |
398 |
267 |
277 |
|||||||||
|
|
|
|
|
|
|
|
|
|
|||||||||
Gross oil-equivalent production |
445 |
191 |
142 |
79 |
|
460 |
202 |
136 |
87 |
|||||||||
(thousands of barrels per day) |
|
|
|
|
|
|
|
|
|
|||||||||
|
|
|
|
|
|
|
|
|
|
|||||||||
Unit cash operating cost ($/oeb) |
31.56 |
31.93 |
24.11 |
45.82 |
|
23.72 |
21.42 |
21.34 |
34.61 |
|||||||||
USD converted at the quarterly average forex |
24.93 |
25.22 |
19.05 |
36.20 |
|
18.26 |
16.49 |
16.43 |
26.65 |
|||||||||
2021 US$0.79; 2020 US$0.77 |
|
|
|
|
|
|
|
|
|
|||||||||
|
|
|
|
|
|
|
|
|
|
|||||||||
|
Twelve Months |
|||||||||||||||||
|
2021 |
|
2020 |
|||||||||||||||
millions of Canadian dollars |
Upstream
|
Kearl |
Cold
|
Syncrude |
|
Upstream
|
Kearl |
Cold
|
Syncrude |
|||||||||
Production and manufacturing |
4,661 |
1,902 |
1,117 |
1,388 |
|
3,852 |
1,585 |
920 |
1,107 |
|||||||||
Selling and general |
- |
- |
- |
- |
|
- |
- |
- |
- |
|||||||||
Exploration |
32 |
- |
- |
- |
|
13 |
- |
- |
- |
|||||||||
Cash operating costs |
4,693 |
1,902 |
1,117 |
1,388 |
|
3,865 |
1,585 |
920 |
1,107 |
|||||||||
|
|
|
|
|
|
|
|
|
|
|||||||||
Gross oil-equivalent production |
428 |
186 |
140 |
71 |
|
398 |
158 |
132 |
69 |
|||||||||
(thousands of barrels per day) |
|
|
|
|
|
|
|
|
|
|||||||||
|
|
|
|
|
|
|
|
|
|
|||||||||
Unit cash operating cost ($/oeb) |
30.04 |
28.02 |
21.86 |
53.56 |
|
26.53 |
27.41 |
19.04 |
43.83 |
|||||||||
USD converted at the YTD average forex |
24.03 |
22.42 |
17.49 |
42.85 |
|
19.90 |
20.56 |
14.28 |
32.87 |
|||||||||
2021 US$0.80; 2020 US$0.75 |
|
|
|
|
|
|
|
|
|
|||||||||
|
|
|
|
|
|
|
|
|
|
|||||||||
(a) Upstream includes Kearl, Cold Lake, Imperial's share of Syncrude and other. |
||||||||||||||||||
After more than a century, Imperial continues to be an industry leader in applying technology and innovation to responsibly develop Canada’s energy resources. As Canada’s largest petroleum refiner, a major producer of crude oil, a key petrochemical producer and a leading fuels marketer from coast to coast, our company remains committed to high standards across all areas of our business.
Source: Imperial
View source version on businesswire.com: https://www.businesswire.com/news/home/20220201005385/en/
Contacts
Investor relations
(587) 476-4743
Media relations
(587) 476-7010


