Bentonville, Arkansas-based Walmart Inc. (WMT) is a multinational retail corporation and one of the largest companies in the world by revenue and scale. With a market cap of $980.3 billion, it serves approximately 270 million customers and members weekly and employs about 2.1 million people worldwide.
Companies valued at more than $200 billion are generally considered “mega-cap” stocks, and Walmart fits this criterion perfectly. Founded in 1962, Walmart operates a global network of over 10,750 retail locations across 19 countries in formats that include supercenters, discount stores, neighborhood markets, and warehouse clubs under the Sam’s Club banner, as well as a substantial e-commerce presence.
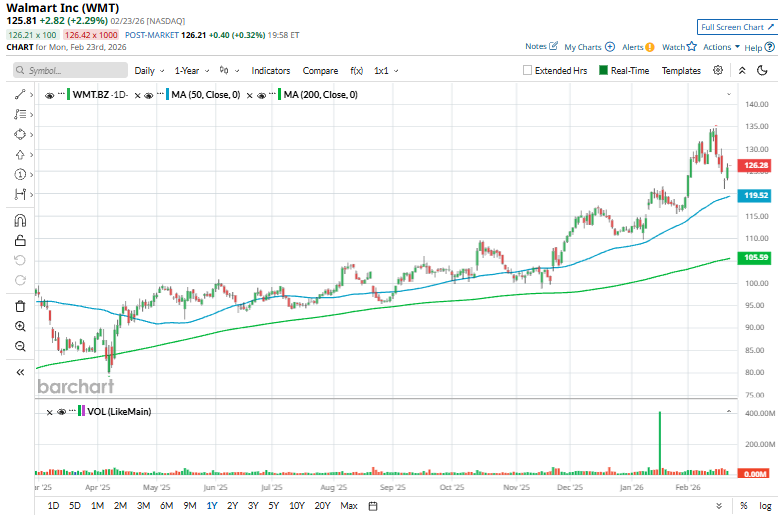
Shares of the company have decreased 6.6% from its 52-week high of $134.69 met recently on Feb. 17. Over the past three months, its shares have surged 19.5%, outshining the SPDR S&P Retail ETF (XRT), which has gained about 8.6% over the same time frame.
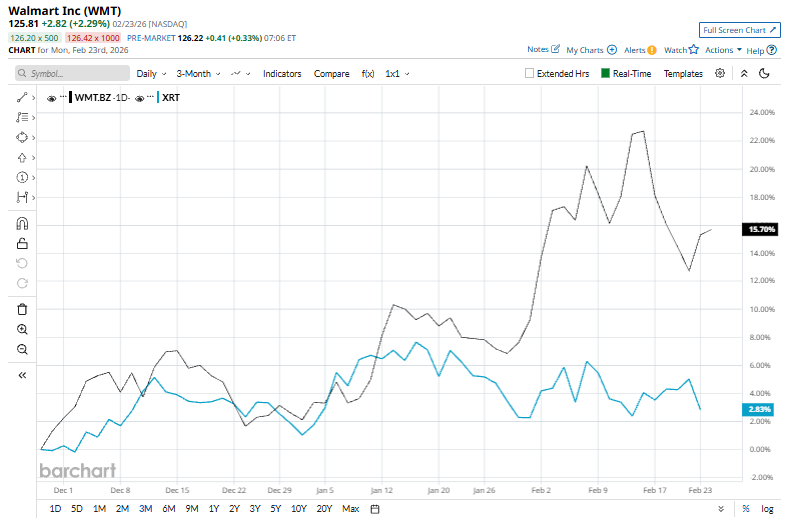
Longer term, WMT stock is up 15.2% on a YTD basis, outpacing XRT’s 1.8% rise. However, shares of the retail giant have returned 15.1% over the past 52 weeks, compared to XRT’s 15.3% rise over the same time frame.
Despite a few fluctuations, the stock has been in a bullish trend, consistently trading above its 50-day moving average since 200-day moving averages since early April.
Walmart shares dipped about 1.4% on Feb. 19 following the release of its Q4 results. It posted solid top-line growth with revenue rising 5.6% year over year to roughly $190.7 billion, driven by resilient grocery demand, 24% e-commerce growth, and continued market-share gains among higher-income households. Operating income increased 10.8% as margins improved, though net income declined due to investment losses. Despite the strong holiday-quarter execution, investor sentiment was tempered by management’s cautious outlook for the year ahead amid macro and consumer-spending uncertainty.
Additionally, WMT stock has outpaced its rival, Costco Wholesale Corporation (COST). COST stock has soared 14.3% YTD and has dipped 4.7% over the past 52 weeks.
Analysts remain bullish about its prospects. The stock has a consensus rating of “Strong Buy” from 38 analysts in coverage, and the mean price target of $137.11 is a premium of 9% to current levels.
On the date of publication, Kritika Sarmah did not have (either directly or indirectly) positions in any of the securities mentioned in this article. All information and data in this article is solely for informational purposes. For more information please view the Barchart Disclosure Policy here.
More news from Barchart