Covered call exchange-traded funds (ETFs) are all the rage. And as I’ve said here, there, and everywhere — I don’t get it. It is not that I’m anti-income. Just the opposite, in fact. But these ETFs do not typically add to return, and they don’t remove much risk of major loss. Historically, most of them get about 80% to 95% of the upside of the underlying ETF or stock index basket. And roughly the same portion of the downside.
In other words, take an ETF that writes covered calls on the S&P 500 Index ($SPX) or Nasdaq 100 ($IUXX). If you look at the returns over time for those ETFs, they will likely track those indexes up and down. Most of their value to investors is to convert gains in that index into monthly cash flow.
But what about when the underlying index doesn’t go up? Not just for a little while, but for years? Oops.
What happens to the covered call ETF? It keeps paying you a decent income. That’s the part you see hit your account each month. But if you also look at your account holding that ETF, guess what? It is down. Way down.
An Example That Shows the Difference — And Maybe the Disconnect
This table shows the Nasdaq QQQ Invesco ETF (QQQ) and the GX Nasdaq-100 Covered Call ETF (QYLD). QQQ, you likely know well. It is approaching $400 billion in assets. QYLD is no slouch, at more than $8 billion, making it the largest covered call ETF tied to an index. JPM Equity Premium Income ETF (JEPI) is the biggest in that peer group, but its stock selection is done actively.
QQQ yields next to nothing, but QYLD yields more than 11%. And over the past 12 months, that yield has served to offset a decline in QYLD’s price. Because funding the income distribution is done by writing covered calls on the Nasdaq 100, a process that sacrifices upside potential for option income now.
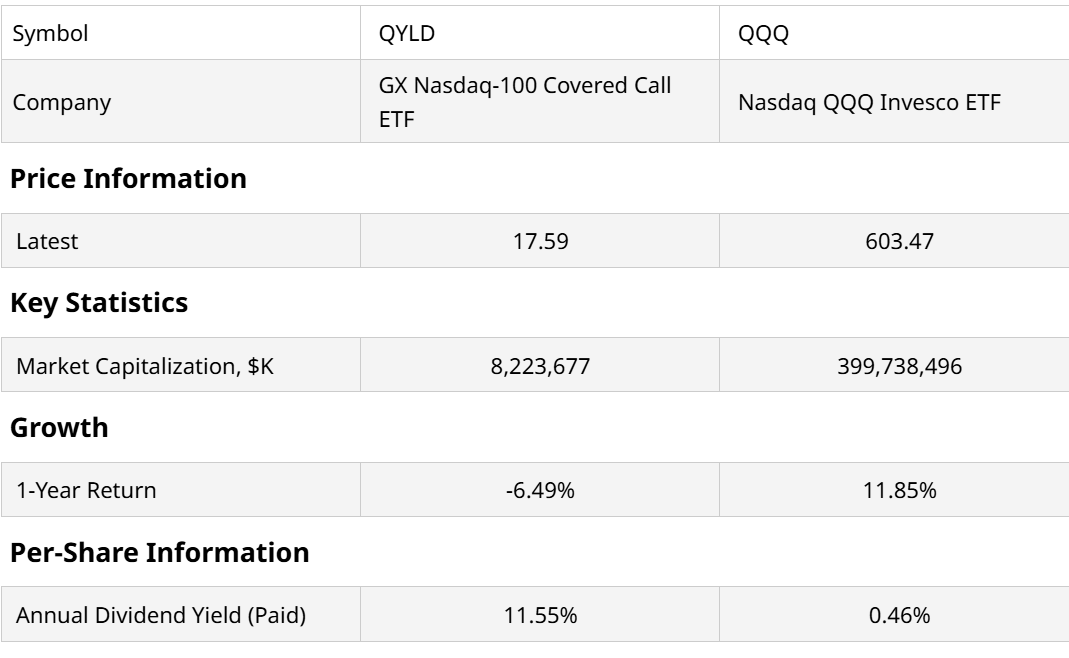
In round numbers, over the past 12 months, QQQ has made 12%. QYLD has made about 6%, which is the yield minus the “principal drag” from forsaking most of the upside in order to spin off monthly cash flow, funded by option premiums.
Most covered call ETFs work similarly. And here’s where I think the disconnect is: When the underlying, QQQ in this case, goes up nicely, no one notices the mechanics. But what about when QQQ goes down, and not just for a month or two?
We don’t have to wonder. Because the bond market has just given us three years of evidence. To show what could be the fate of many billions in equity covered call ETFs in the years ahead, I’ve analyzed the relationship between 20+ Year Treas Bond Ishares ETF (TLT), which is currently the seventh-largest bond ETF at $45 billion in assets, and an ETF that writes covered calls on TLT, the Ishares 20+ Year T-Bond Buywrite Strategy ETF (TLTW). And since part of my punchline here is that one of my favorite ways to offset those very evident risks of covered call ETFs is to take two additional steps:
1. Hedge it, using an ETF that essentially shorts the underlying security that the covered call ETF is writing income on. In simple terms, we are saying, “Give me the income from the covered call writing, but offset the price risk.” The Short 20+ Year Treasury -1X ETF (TBF) is structured to move opposite TLT, and TLTW is just TLT with covered-call writing. So, TBF is a good pairing with TLTW, to hedge the downside risk. At least at first glance.
The net result, however, might eliminate too much of the total return. So there’s another step.
2. Manage the pair “tactically.” All that means is you own TLTW and TBF, to get that hedged impact and keep the income. But rather than own them in fixed-percentage weightings, you allocate between them, adjusting those weightings as market conditions dictate.
How do you determine when and how much to tilt this two-ETF portfolio (TLTW and TBF) one way or the other, at any point in time? There are many ways. I can only speak for the one I created, which I have covered here before. The ROAR score approach, which prioritizes confronting downside risk via a 0-to-100 score, updated daily. 100 is low risk, 0 is high risk, 50 is neutral risk.
I applied the ROAR scores for TLTW and TBF over the past three-plus years, and created a mechanism to automatically calculate the weightings for the two ETFs at any point during that time. Then, I strung the returns together, shown below.
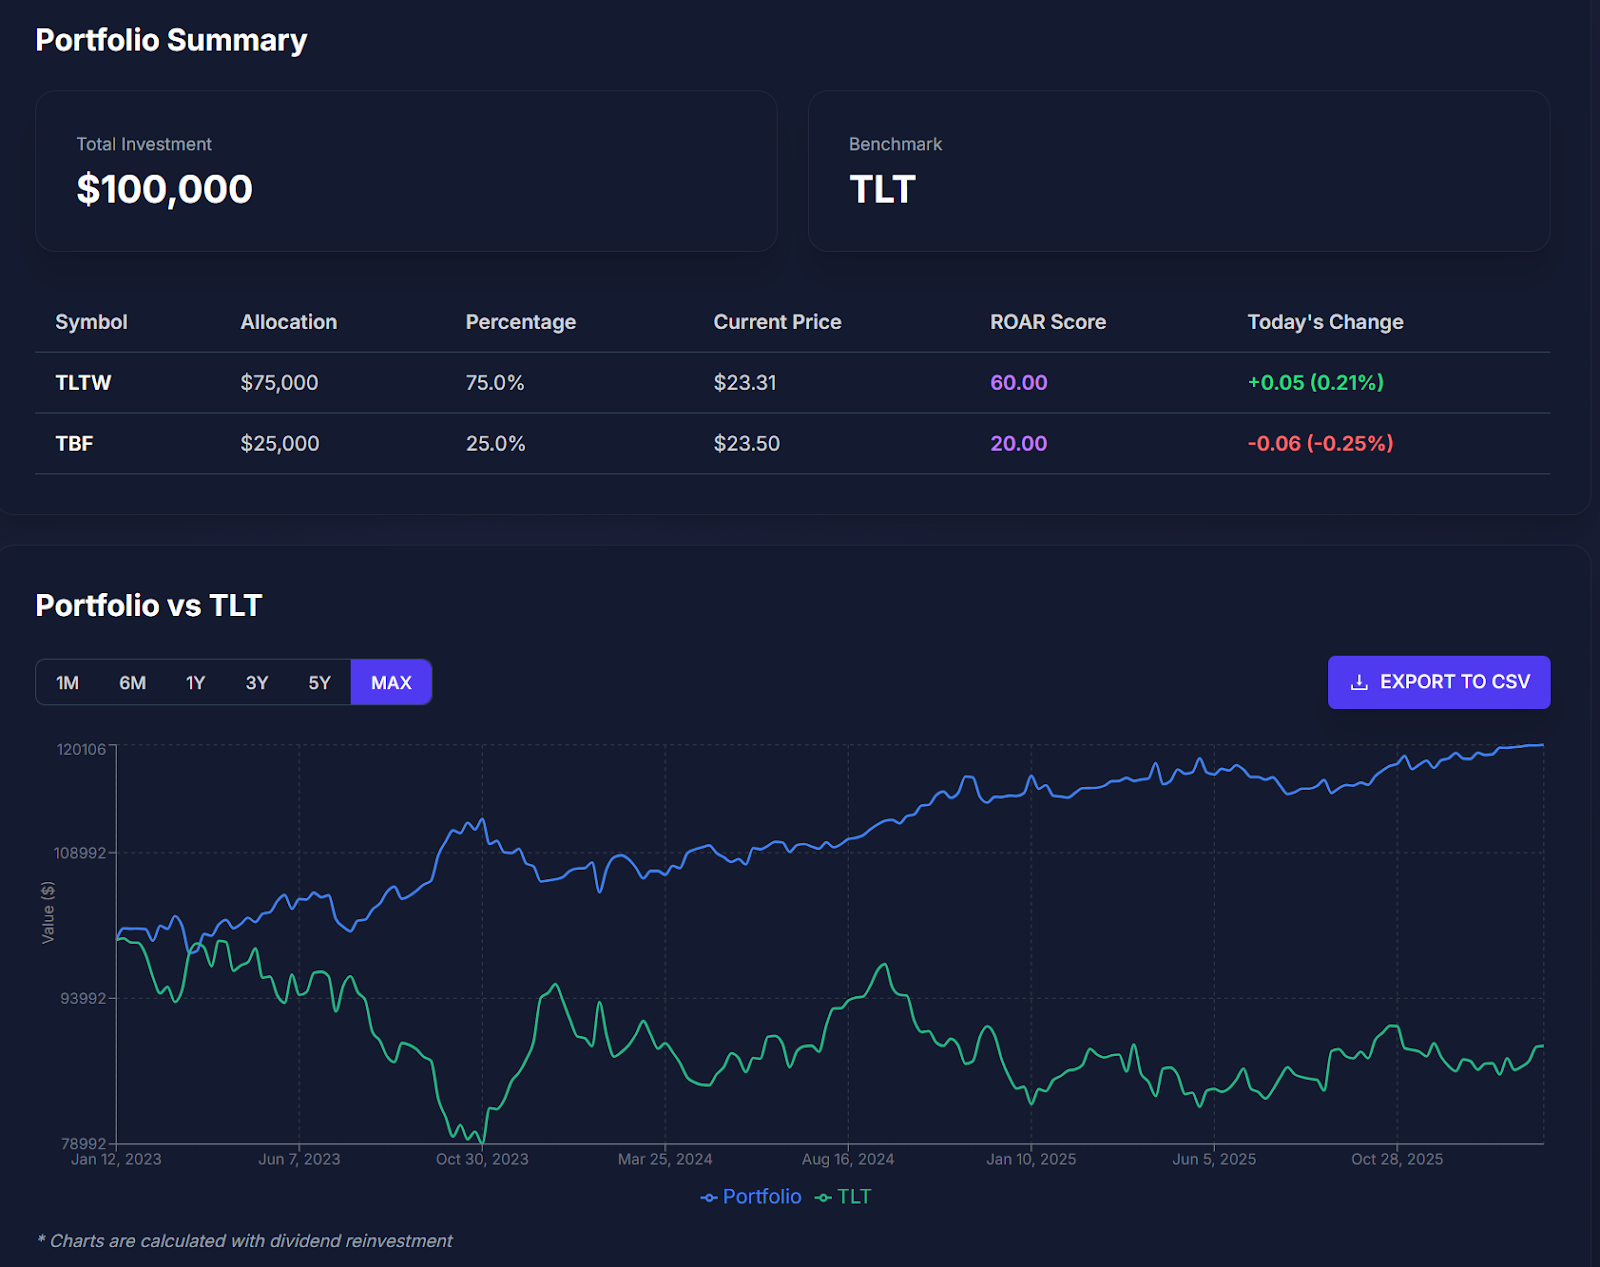
That blue line above is frankly what prompted me to bring this to the attention of this audience. Because the stock market has not been an ideal stress-test environment for the downside risk of covered call ETFs the past few years.
But bonds have been a great testing ground. TLT, in particular, as it has been a very inconsistent return-generator.
That blue line is the two-ETF mix “ROARed,” if you will, over that time. We see the dramatic outperformance of that TLTW-TBF mix, with the ROAR score directing traffic compared to TLT alone. This is akin to the earlier example, and saying that a mix of QYLD and the Inverse Nasdaq 100 ETF (PSQ) is likely to outperform QQQ strongly in a bear market. Because you have the downside covered, and you still have most of the income rolling in.
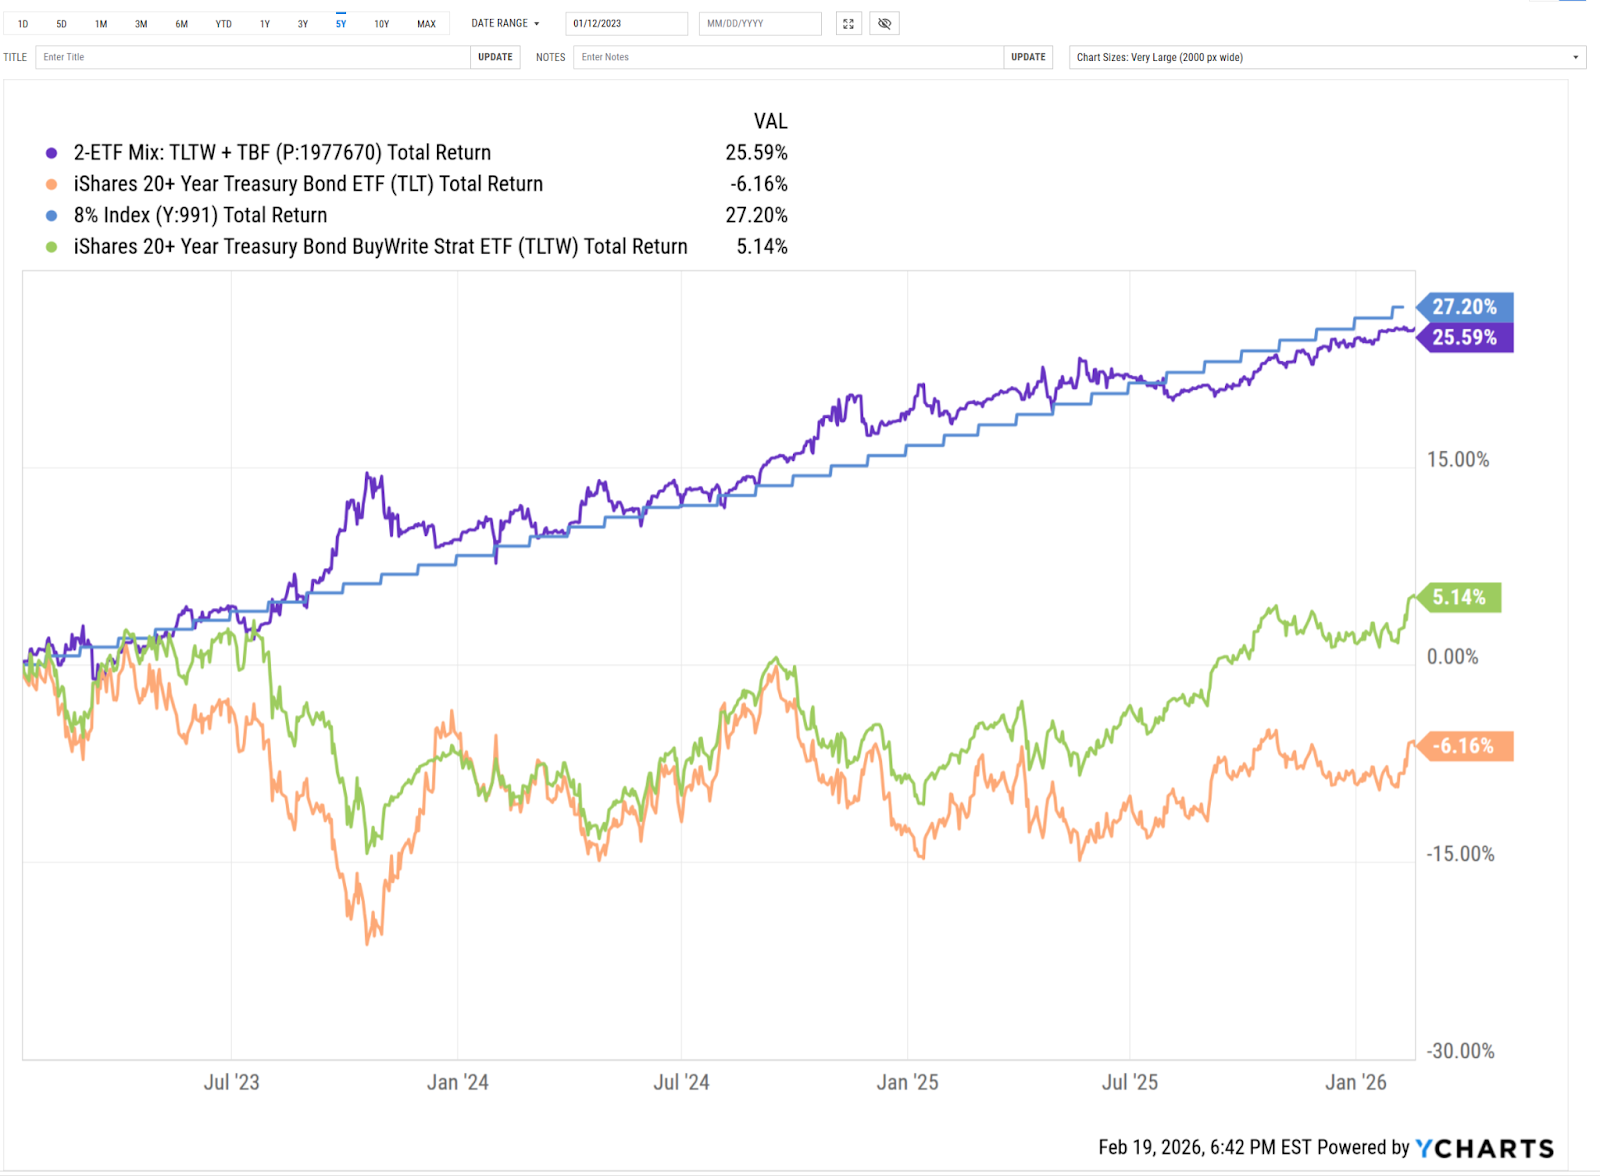
Finally the graph above looks at that same portfolio but versus TLTW and TLT, as well as comparing it to a straight-line 8% return. Quite a correlation to the latter.
The Takeaway
This is just one quick example of the power of hedging, but also the willingness to be an active investor amid the post-pandemic market environment. Because I don’t think it's changing back to the old way any time soon. And whether you use something like ROAR, or you create or follow any other tactical discipline, this shows that covered call ETFs are not all bad in tough markets — as long as you know how to give them some company, to smooth the ride.
Rob Isbitts created the ROAR Score, based on his 40+ years of technical analysis experience. ROAR helps DIY investors manage risk and create their own portfolios. For Rob's written research, check out ETFYourself.com.
On the date of publication, Rob Isbitts did not have (either directly or indirectly) positions in any of the securities mentioned in this article. All information and data in this article is solely for informational purposes. For more information please view the Barchart Disclosure Policy here.
More news from Barchart


