As I was recently scrolling through tons of exchange-traded fund (ETF) and stock charts on Barchart.com, in multiple time frames, something caught my eye.
It prompted an audible, “Oh, wow!” and I knew I had to tell you about it. Because while these types of moments do not always turn into major market moves, sometimes they do. And as I always say, long-term trend changes start with short-term price action.
At issue is the Nasdaq 100 ETF (QQQ). This ETF is big and powerful, the closest thing the ETF world has to omnipotent. The S&P 500 Index ($SPX) gets the biggest “pub” from investors, but QQQ is where the consistently magnificent returns have come from. So it matters when any type of potential crack makes itself evident. I see one now.
Below is QQQ’s daily chart. It is weeping like a tree — the kind that weep, anyway. The 20-day moving average (in red) is about three weeks into a downtrend, and the 50-day has joined it in the loss column. The 200-day EMA is flat, and that in itself is remarkable. That hasn’t happened much the past two years, as you can see below. It has been a series of long positive moves, interrupted by occasional short bursts to the downside.
What makes QQQ the “king” of this market is its resilience. Small caps? Forget about ‘em! Dow Industrials (DIA)? Old fashioned — not to me, but to many traders and media personalities, too. International stocks? Maybe next century. But QQQ? Ah, the once and future leader of all things stock market.
But suddenly, it is showing its human side, so to speak.
QQQ’s Chart Looks Ominous From This Angle
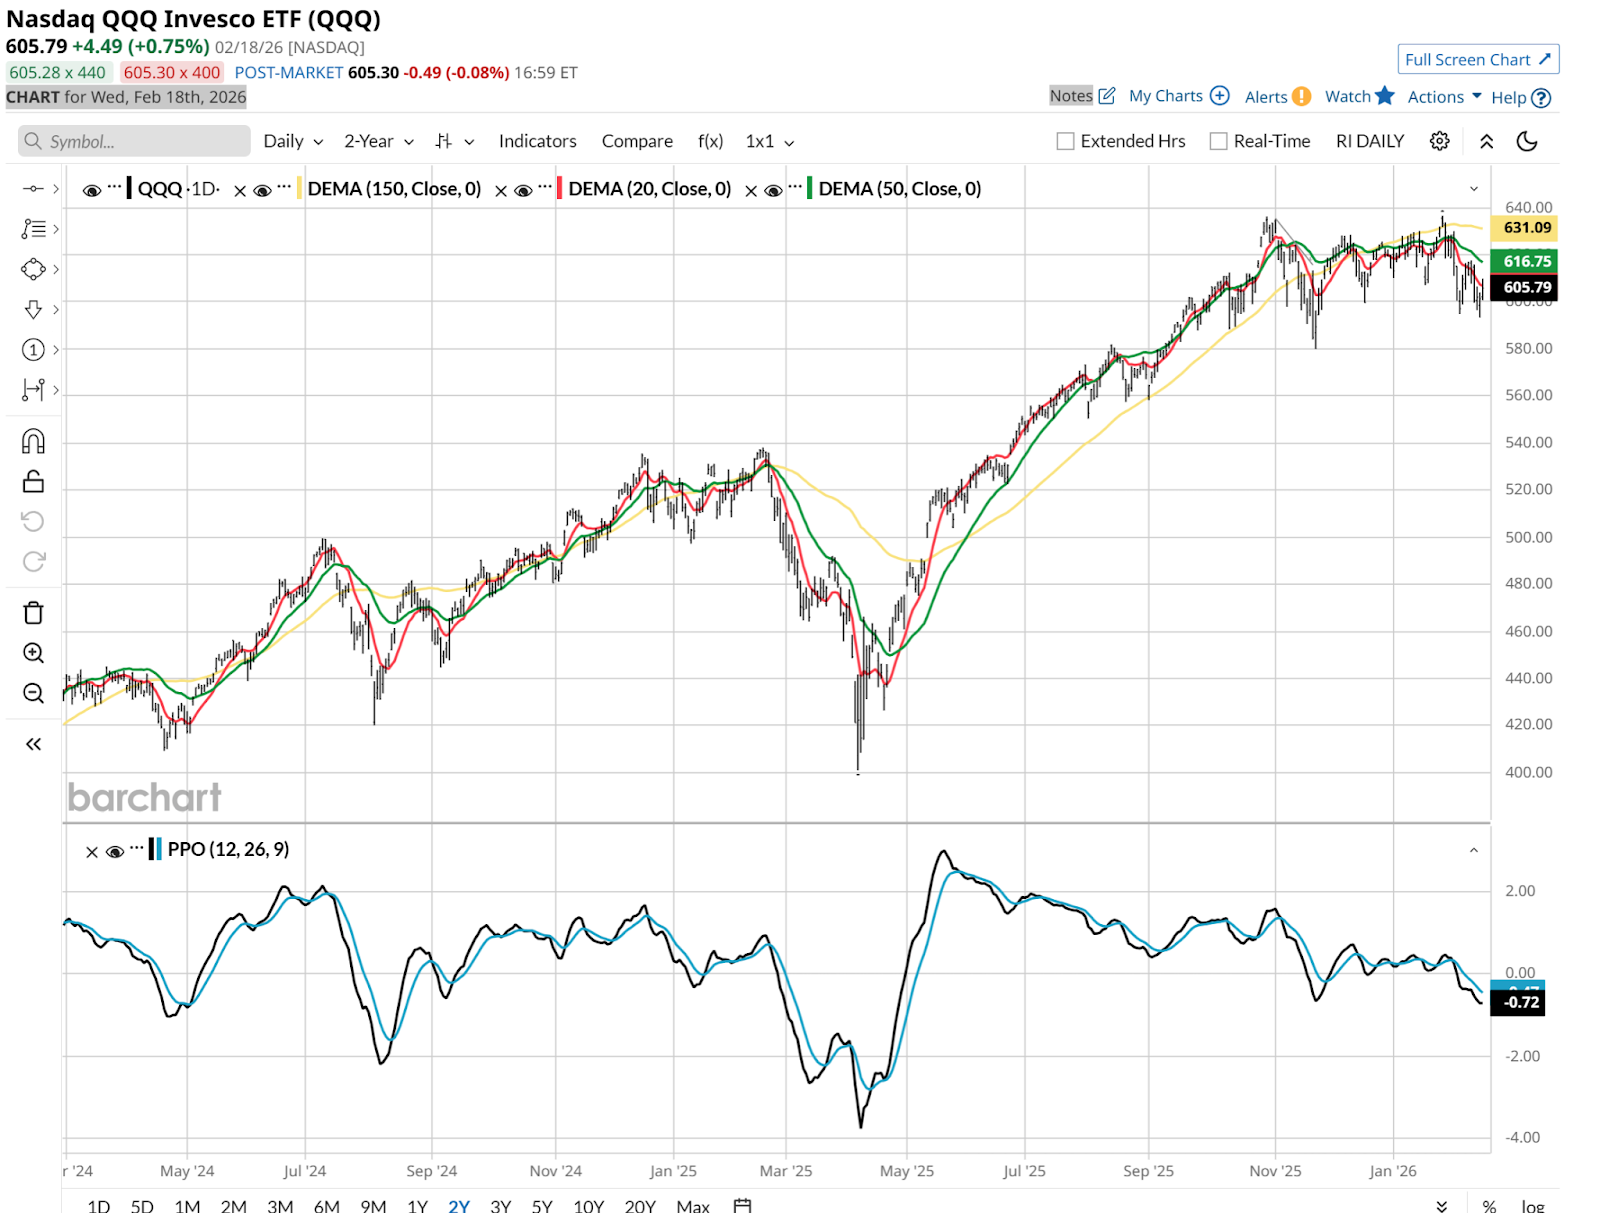
Those moving averages are slipping, but so is the PPO, my all-time favorite momentum indicator. It just dipped under the zero line, which is a big deal to me.
Does this mean QQQ crashes soon? That’s an impossible question. And more to the point, it is irrelevant. If you learn how to hedge — with collars, other option strategies, inverse ETFs, position sizing, etc. — you can invest in anything. This is less about timing, and more about a gathering docket of evidence. QQQ is bent, not broken. But you don’t get a serious market reversal (downward) without some bending action first.
This is not a new situation. It has been rolling over subtly for weeks. But what made me utter something I can’t write here was this hourly chart below. That’s a three-week downtrend, which again reversed at exactly where it should ($610 area) on Wednesday afternoon. I’ll point out that what turned a nice positive day for QQQ into a 1% intra-day dip in about 150 minutes, started a full hour before the Fed’s latest minutes came out.
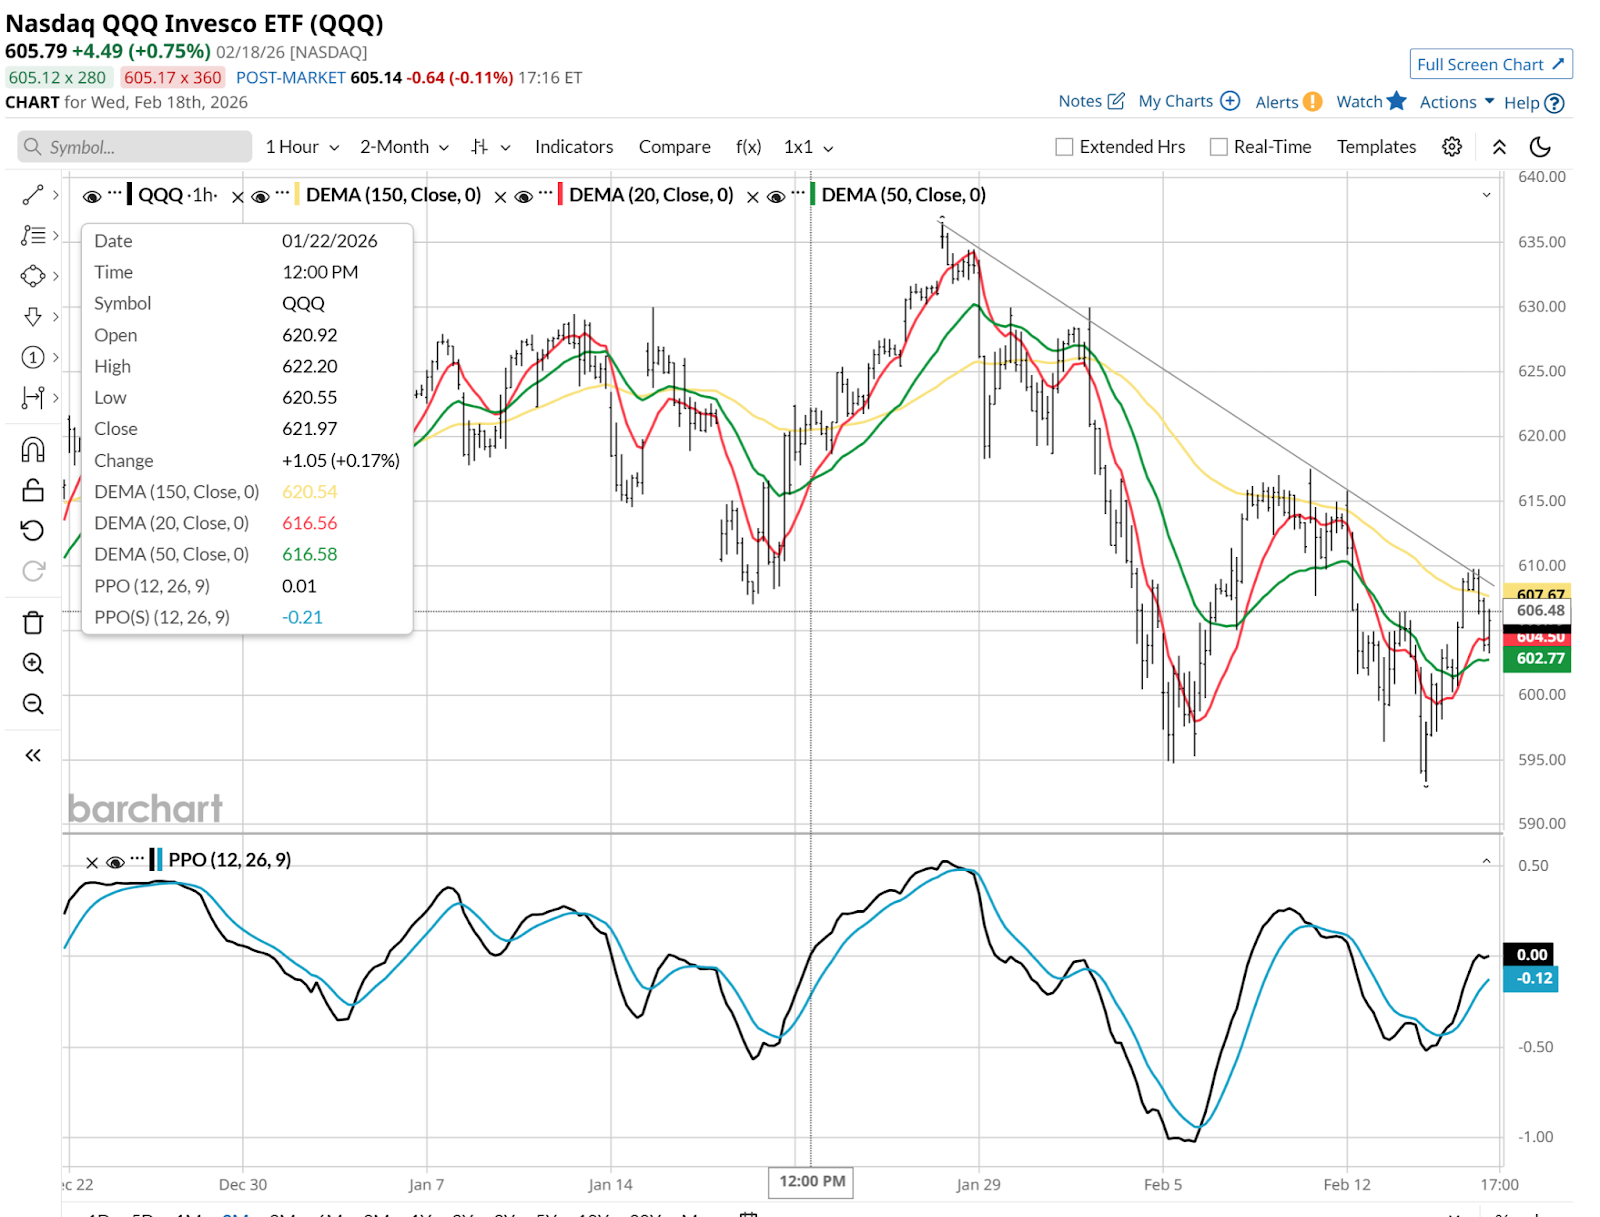
This is micro-analysis, as I see it. But the goal in charting multiple time frames is that the evidence starts to pile on itself. That’s what I’m watching carefully in the days and weeks to come.
OK, What Else You Got?
We technicians like to talk about “confirmation.” That’s when multiple indicators and signals corroborate each other’s conclusions. As regular readers of mine know, I created my own confirmation indicator, that I trained to read the chart for me, as a productivity tool and portfolio-building factor. That’s the ROAR score.
And while I had one “out loud” moment in viewing the short-term QQQ chart I showed you above, I had another one when I was reviewing ROAR scores and saw this.
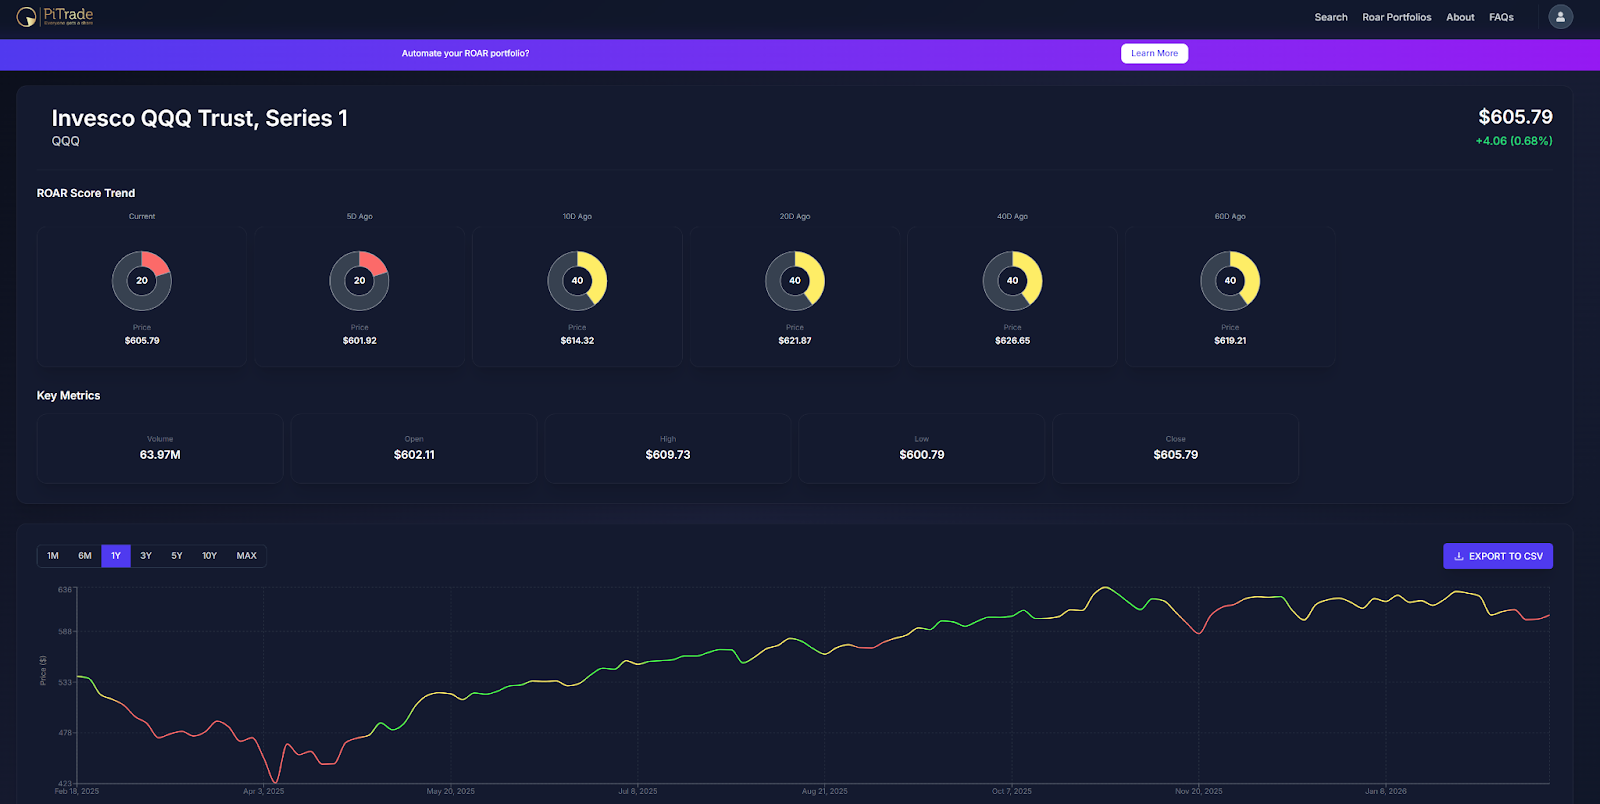
QQQ has been knocked down to a score of 20. Loosely translated, that means it has about a 4:1 change of substantial decline going forward, versus a strong rally. I’m not talking about the next few points in either direction. That’s noise. I’m talking about breaking the months-long pattern that has QQQ trading where it did more than four months ago. In this market, for buy-the-dips-trained investors, that’s a lifetime.
The other thing I track constantly in my trading is a different type of sync up activity. With upcoming market news and events. And last I checked, Nvidia’s (NVDA) earnings are next week. And that’s hardly the only macro news on tap between now and February-end.
And yes, you read that right. NVDA is macro news now. QQQ’s direction will lean heavily on it, along with the other handful of stocks that crowd the top of the Nasdaq 100 Index. Time to pay close attention.
Rob Isbitts created the ROAR Score, based on his 40+ years of technical analysis experience. ROAR helps DIY investors manage risk and create their own portfolios. For Rob's written research, check out ETFYourself.com.
On the date of publication, Rob Isbitts did not have (either directly or indirectly) positions in any of the securities mentioned in this article. All information and data in this article is solely for informational purposes. For more information please view the Barchart Disclosure Policy here.
More news from Barchart


